The Native Memory tab displays native memory and native handle allocations that are still waiting to be deallocated.
If you wish to view historical allocations (memory that has been deallocated), please view the Analysis / Query tab.
This memory view also displays leaked memory, handles and memory errors, such as double frees, incorrect frees, uninitialized data etc.
 Read on, or click a part of the image below to jump straight to the help for that area (the icons link to a different page).
Status Information
The very top line of the memory tab gives a brief summary of:
•memory allocated and number of blocks
•memory leaked and number of blocks
•handles allocated and leaked
•the number of errors
The status line is only updated when the Refresh button is pressed or when data is added to the display automatically.
More up-to-date information can be found on the Running Totals Dialog or the Types view.
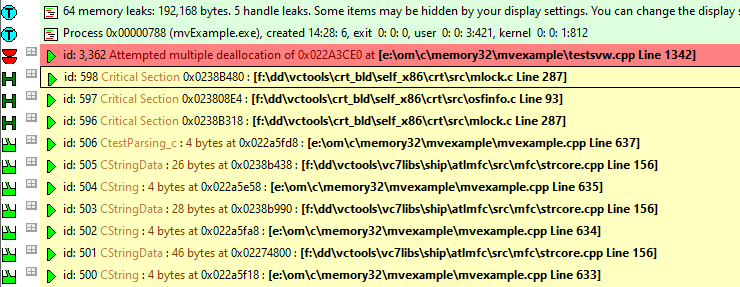
This example shows a status line after the target application has exited (hence 0 bytes for current memory):

The main display shows the live collected data during or after the application running. Memory that has been allocated and then freed is not shown.
 Initially no data will be displayed until the data is manually refreshed or the automatically updated with significant errors as they happen.
Each line has an icon at the left, indicating its type, and has an explanatory tooltip:

The text on each line indicates:
•datatype (if known)
•size
•allocation address/handle value
•source file and line number (if available) where the allocation occurred
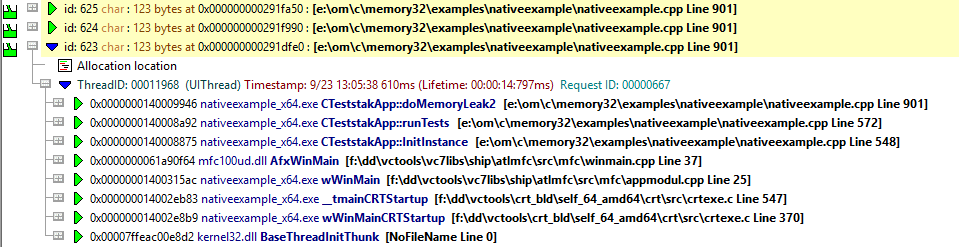
•optional event sequence id at the beginning of the line
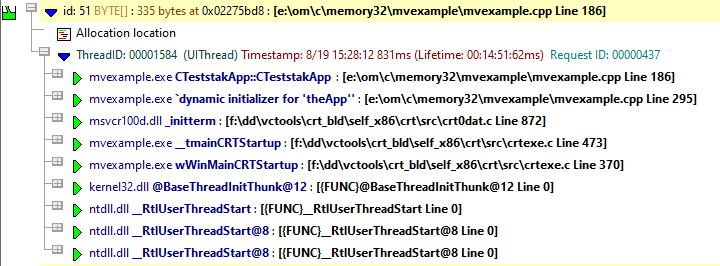
The background colour for each line indicates the status of the data - eg, leaked, damaged, or uninitialized.
This example shows memory allocations and handles in yellow are leaked, while the red line shows a serious occurrence of damaged memory.
Examining a data item
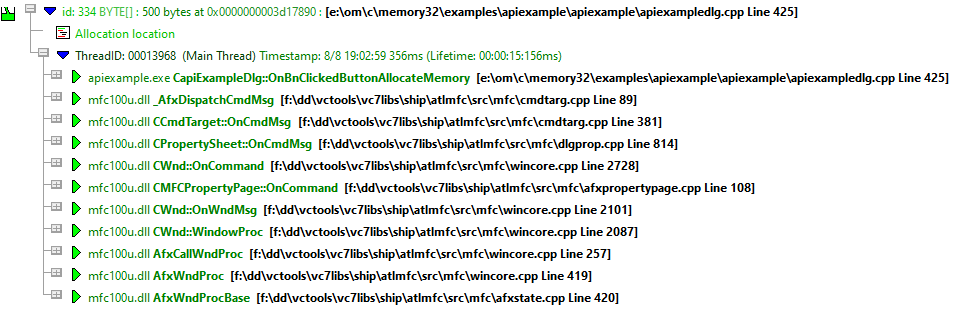
Each item can be expanded with the  button ( and then collapsed with the
  ) to show more detailed information:
•brief description of the item's purpose (allocation location, reallocation location, etc)
•thread id, and the name if assigned
•timestamp
•lifetime of the item
•allocation request ID (if there is one)
•the callstack for the item
Each line of the callstack shows
•instruction address
•module name
•undecorated C++ function name
•source file and line number (if available) for the function
For allocations that Memory Validator has seen allocated with an identical callstack to a previous allocation that has been deallocated, that callstack and the top line entry are coloured green. This is a hint that allocations at this callstack location have been seen to be deallocated and that this location may not leak memory (although conditional logic may mean that it does).
Type
The type is simply that of the memory allocation, determined by parsing the source code at the allocation location, eg char[] in our example above.
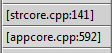
When a type cannot be determined, a pseudo-type is created by merging the filename and the line number for the allocation:
Multiple allocations
It is not uncommon for multiple allocations to happen in the same location, with the same callstack.
For such allocations we simply the display by grouping all such allocations together as one callstack entry, indicating how many allocations, the total amount of memory (or handles) allocated and the largest allocation.
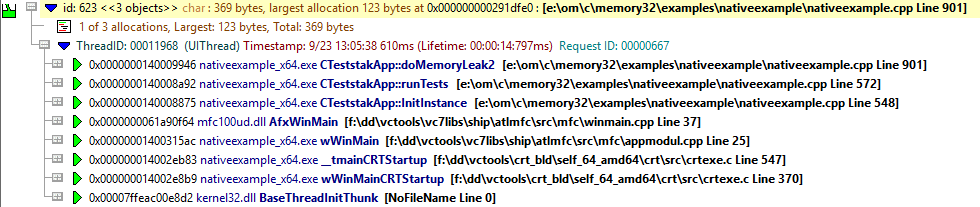
If you prefer to view all allocation callstacks individually, the display settings can be changed to allow that.
Examining the callstack and code
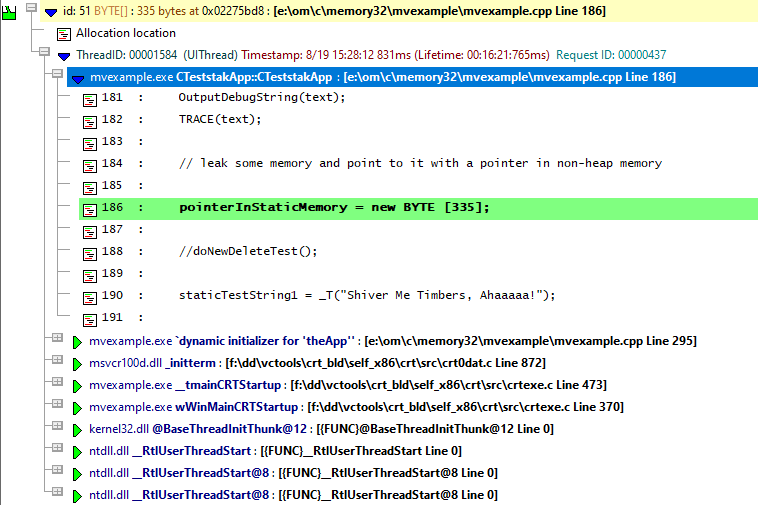
One or more parts of the callstack can be expanded or collapsed using the or to show the source code around the relevant line in the associated file.
If the source code can't be found, or the file location is invalid you'll be prompted for the file.
The line on which the allocation occurred is highlighted, e.g. green in this example:
To edit the source code, double click on any part of the lines of source code displayed or use  Edit Source Code...
Source file not found automatically?
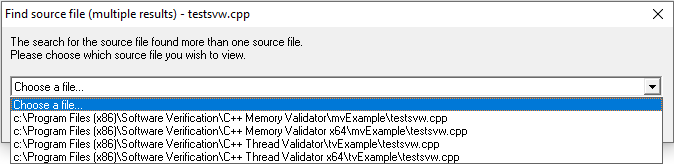
If the source file isn't found automatically, you'll be prompted to provide the location manually with the Find Source File dialog
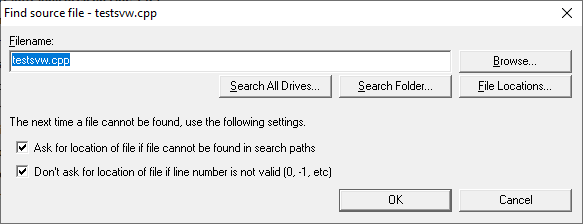
You can scan, search or browse for the source location depending on how much of an idea you have of the location:
•Browse...  uses an explorer to search manually
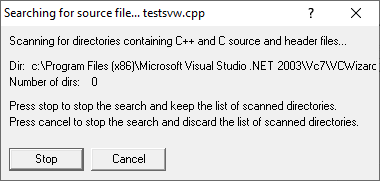
•Search All Drives... does a full scan of your computer, showing the Searching For Source Files dialog
You can stop the search at any time
If a file is found, the filename is entered at the top of the Find Source File dialog.
If multiple results are found, pick the best one from the results dialog that appears:
•Search Folder... prompts for a folder, and scans that using the same Searching For Source Files dialog as above
If multiple results are found, pick the best one from the results dialog (above)
Rather than repeatedly searching manually for locations, it's recommended to modify the automatic source file search paths:
•File Locations... shows the File Locations Settings dialog so you can change the automatic search paths
Changing the search paths to include additional source locations means you'll get prompted less.
The file locations settings dialog is identical to the File Locations page of the global settings dialog.
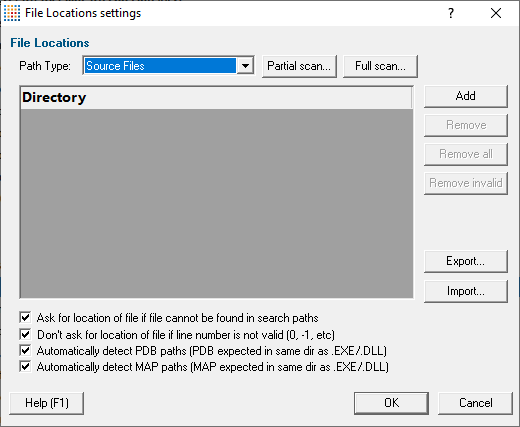
If you don't want to be prompted with this dialog, then uncheck the first option below
•Ask for location of file if file cannot be found in search paths shows this dialog each time you try to open a source file where the location is unknown
•Don't ask for location of file if line number is not valid stops this dialog from showing when line numbers are invalid, e.g. zero or negative
The default is not to ask in this case.
Navigation shortcuts
Two navigation keyboard shortcuts are provided. They collapse the current entry, move to the next or previous entry and then expand that entry to show the full callstack.
To move to the previous top level entry press 

To move to the next top level entry press 
Memory tab options
The following controls are displayed to the left of the data area
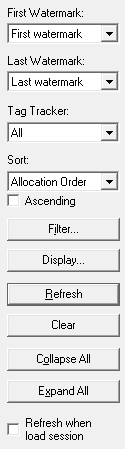
Watermarks
The amount of data in the main display can be reduced by filters and watermarks.
Here you can choose two watermarks allowing only the data between them to be displayed.
•First Watermark Choose a watermark from the list Last Watermark Choose another watermark Refresh updates the data shown in the display
There are two permanent default watermarks, called First watermark (before anything else) and Last watermark (after anything else).
Attempting to choose a first watermark later than the last watermark, or vice-versa will result in the alternate watermark automatically updating.
Tag Tracker
Data tracking allows you to associate collected allocation data with an id or tag.
If using data tracking, you can then choose here which of your tags you want allocations to be displayed for.
•Tag Tracker Choose a tag from the list Refresh updates the data shown in the display
There are two permanent tags: All which filters nothing (the default), and None which shows everything that is untagged.
 This type of tag tracker and watermark selection is also used in the Tag Tracker and Watermark view of the Types and Sizes tabs, as well as the Hotspots and Analysis tabs.
Sorting
The data on the display can be ordered using the following attributes and in an ascending or descending direction - just pick an attribute and click Refresh.
•Allocation Order •Num Allocations •Size •Total Size •Object Type •Tag Tracker •Filename •DLL •Address |
|
•Ascending Refresh when ticked shows the biggest, newest, etc. last, otherwise first if unticked
Local filters and settings
•Filter... shows the local filters dialog for the memory tab
The filter button also indicates the number of local filters, although not all of these may be enabled

•Display... shows the Memory Tab Display Settings dialog to set the types of data and messages displayed in the data view
Updating the display
•Refresh updates the display - as does the  button on the Tools menu and toolbar
•Clear removes all data from the display
•Collapse All collapse all data items, whilst remembering any source code views that were open
•Expand All expand all data items including any previously expanded sections of source code
•Refresh when load session when ticked updates the display immediately when a session is loaded from a file
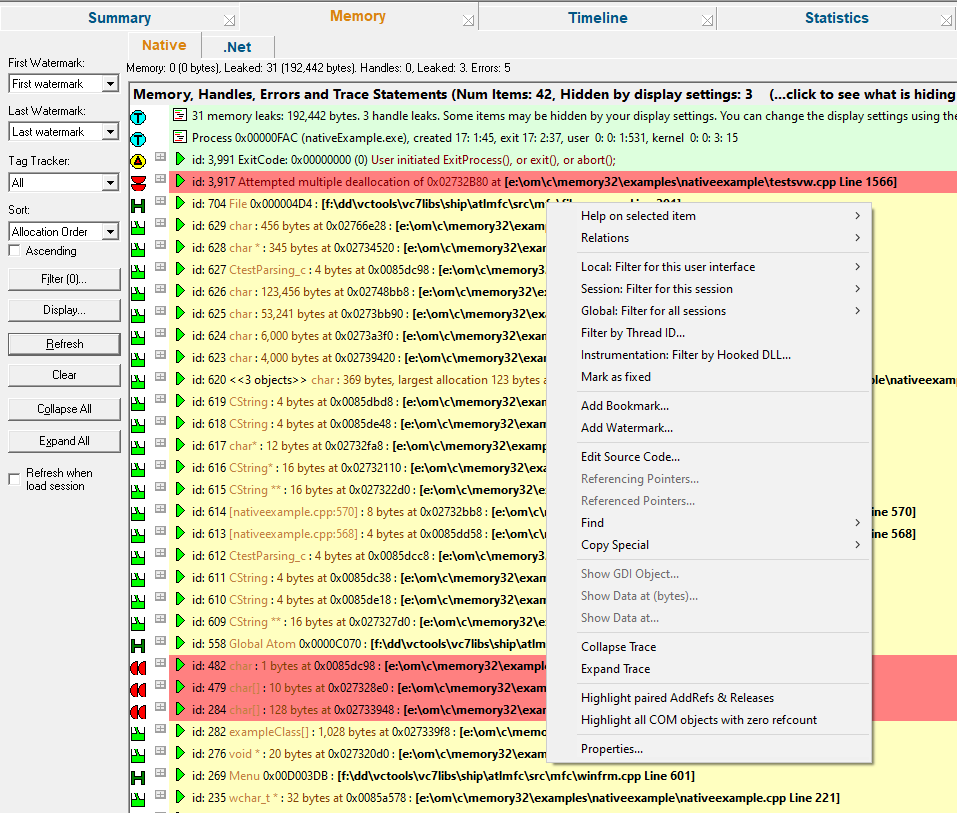
Memory view popup menu
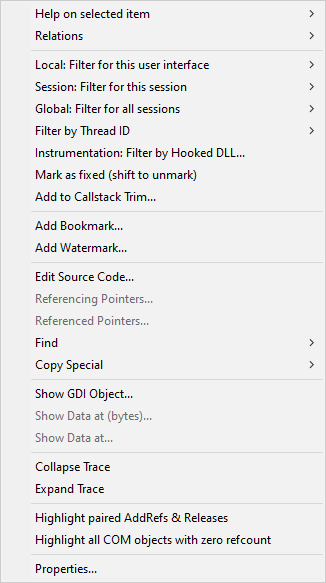
The following popup menu is available over the data area
Click on any part of the menu to jump straight to the topic below:
Menu option: data item summary
•Help on selected item the sub-menu shows a simple one line description of the type of data that has been selected:

Menu option: relations
The relations menu has a large sub-menu with many different options for choosing a set of related data to display in the upper analysis window.
Think of this as a sub-query on the working data - like searching for friends of friends on a social network!
Given an entry in the upper window, available relations are as follows, with allocations generally meaning any allocation, reallocation or deallocation
•Same address •Same size •Smaller •Larger |
Finds any other allocations on the same memory address, for example previous allocations or frees Allocations on any memory objects of identical size or on smaller or larger objects |
|---|---|
•Same handle |
Finds any other allocations on the same resource handle |
•Same location, |
Finds other allocations made at the source code location: different callstacks or any callstack |
•Same function •Same source file •Same DLL |
All allocations from the same function... or the same file or the same DLL |
•Class allocations |
All allocations, reallocations or deallocations from the same C++ class |
•Relations to 'this' |
Finds various other events relating to the selected object:
Allocator of this - only for reallocated objects Reallocation of this Reallocation of this address at same address Reallocation of this address at different address Deallocation of this Allocations, reallocations, deallocations Referenced by this - these two need the target application to still be running Referencing this |
•Allocations within |
For memory allocations, finds all other allocations within a range of 32 bytes up to 4Kb of this one |
•Allocations prior •Allocations after |
For memory allocations, finds the previous 5, 10 or 20 allocation events or the next 5, 10 or 20 events |
•Errors |
Shows any known damaged memory allocation information relating to this entry |
Menu option: filters
The next three options provide a powerful way of filtering the data to exclude all other items similar in some way to the one you clicked on.
•Local: Filter for this user interface
•Session: Filter for this session
•Global: Filter for all sessions
Each of these options have the same sub-menus:
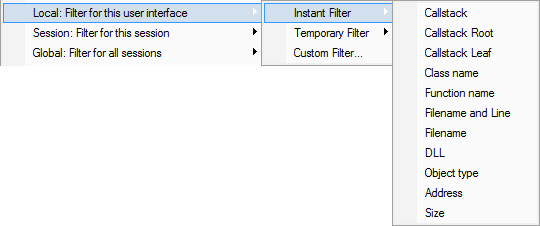
•Instant Filter creates an instant filter based on the selected data item
•Temporary Filter as for instant filter, but will not be saved along with any other filters
The final sub-menu above shows a variety of predefined filters, each of which creates a filter matching that attribute of the selected item.
The term callstack root refers to the function at the top of the callstack, while all other options refer to the lowest item in the callstack - the callstack leaf.
So for example:
•Callstack creates a filter that excludes data items matching the entire callstack of the selected item
•Callstack Root or Leaf excludes items matching the address for the top or bottom of the callstack
Examples of matching callstack root and leaf are shown in the Filter Definition topic.
•Object Type, Size or Address excludes all items with the same allocation type, size or address
•Custom Filter brings up the Define Filter dialog, letting you customise your own filter in more detail
The filter definition will be pre-populated with the callstack and other datatype information to use in your filter.
Menu option: filter by thread id
The Filter by Thread Id submenu has the following options:
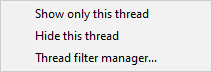
•Show only this thread the thread filter is set to show only the selected thread
•Hide this thread the thread filter is set to hide the selected thread
•Thread filter manager... the thread filter manager is displayed
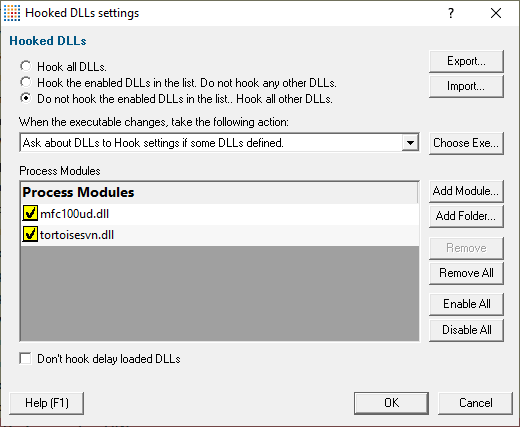
Menu option: filter by hooked DLL
You can filter the next run by DLL, either excluding that DLL, or including that DLL, in the list of DLLs that will be monitored.
The Hooked DLLs settings dialog is displayed.
Menu option: mark as fixed
•Mark as fixed marks the selected item as "I have fixed this"
To remove the marking from the event press the shift key at the same time you choose Mark as fixed on the menu.
Items that have been marked as fixed are shown with a line struck through them.

This allows you to easily identify items that you've worked on and items that have yet to be worked on.
The mark as fixed status is permanent, will display on all user interfaces that display events, and will persist across saving and loading sessions.
Menu option: add to callstack trim
•Add to Callstack Trim... displays the Callstack Trim settings with the selected function added to the list of trimmed functions
Menu option: bookmarks and watermarks
Bookmarks allow you to find a data item easily at a later date, while watermarks are used above to show only those items between two points in time
•Add Bookmark... adds a bookmark for the selected item
•Add Watermark... adds a watermark for the selected item
Menu option: editing source code
•Edit Source Code... opens the default or preferred editor to edit the source code
Menu option: pointers in and out
•Referencing Pointers... shows all pointers in the target program that point to the selected item
•Referenced Pointers... shows all pointers in the target program identified by the selected item
Referencing and referenced pointers are shown in the same references dialog as when finding addresses.
These options are only available while the target application is running
The find option and sub-menus below allow you to use the address or the object type of the allocation to say things like:
Show me all the data items that have the same allocation type as the selected item
or
Add to the Analysis tab all the data items where the allocation address is the same as the selected item

The results can be displayed in one of three places:
•the Address Query Dialog if you choose By Address Using Find Dialog...
•the Object Query Dialog if you choose By Type Using Find Dialog...
•the Analysis tab when choosing Using Analysis Tab for both Address and Type
The copy special sub-menu lets you copy to the clipboard any of the following attributes, (or all the information):
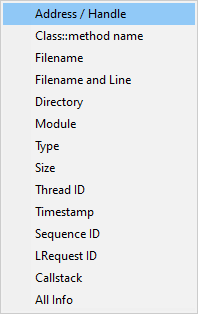
This can be very useful if you need to use the address, file name or other attribute of an allocation elsewhere in Memory Validator; an external application, or just to share with a colleague.
Possible areas in Memory Validator that you might need such data include:
...and other similar tools.
Here's an example of copying All Info to the clipboard:
c:\program files (x86)\software verification\c++ memory validator\examples\nativeexample\testsvw.cpp
nativeExample.exe
Thread ID: 284736
11/23 12:28:33 267ms (Lifetime:00:06:25:666ms)
Sequence: 854
nativeExample.exe CTeststakView::OnTestDoublefreeofmemory : [c:\program files (x86)\software verification\c++ memory validator\examples\nativeexample\testsvw.cpp Line 1152]
mfc90ud.dll _AfxDispatchCmdMsg : [f:\dd\vctools\vc7libs\ship\atlmfc\src\mfc\cmdtarg.cpp Line 81]
mfc90ud.dll CCmdTarget::OnCmdMsg : [f:\dd\vctools\vc7libs\ship\atlmfc\src\mfc\cmdtarg.cpp Line 381]
mfc90ud.dll CView::OnCmdMsg : [f:\dd\vctools\vc7libs\ship\atlmfc\src\mfc\viewcore.cpp Line 162]
mfc90ud.dll CFrameWnd::OnCmdMsg : [f:\dd\vctools\vc7libs\ship\atlmfc\src\mfc\winfrm.cpp Line 942]
mfc90ud.dll CWnd::OnCommand : [f:\dd\vctools\vc7libs\ship\atlmfc\src\mfc\wincore.cpp Line 2363]
mfc90ud.dll CFrameWnd::OnCommand : [f:\dd\vctools\vc7libs\ship\atlmfc\src\mfc\winfrm.cpp Line 365]
mfc90ud.dll CWnd::OnWndMsg : [f:\dd\vctools\vc7libs\ship\atlmfc\src\mfc\wincore.cpp Line 1769]
mfc90ud.dll CWnd::WindowProc : [f:\dd\vctools\vc7libs\ship\atlmfc\src\mfc\wincore.cpp Line 1755]
mfc90ud.dll AfxCallWndProc : [f:\dd\vctools\vc7libs\ship\atlmfc\src\mfc\wincore.cpp Line 240]
mfc90ud.dll AfxWndProc : [f:\dd\vctools\vc7libs\ship\atlmfc\src\mfc\wincore.cpp Line 402]
mfc90ud.dll AfxWndProcBase : [f:\dd\vctools\vc7libs\ship\atlmfc\src\mfc\afxstate.cpp Line 441]
USER32.dll gapfnScSendMessage : [{FUNC}gapfnScSendMessage Line 0]
USER32.dll GetThreadDesktop : [{FUNC}GetThreadDesktop Line 0]
USER32.dll CharPrevW : [{FUNC}CharPrevW Line 0]
USER32.dll DispatchMessageW : [{FUNC}DispatchMessageW Line 0]
mfc90ud.dll AfxInternalPumpMessage : [f:\dd\vctools\vc7libs\ship\atlmfc\src\mfc\thrdcore.cpp Line 181]
mfc90ud.dll CWinThread::PumpMessage : [f:\dd\vctools\vc7libs\ship\atlmfc\src\mfc\thrdcore.cpp Line 899]
mfc90ud.dll CWinThread::Run : [f:\dd\vctools\vc7libs\ship\atlmfc\src\mfc\thrdcore.cpp Line 629]
mfc90ud.dll CWinApp::Run : [f:\dd\vctools\vc7libs\ship\atlmfc\src\mfc\appcore.cpp Line 864]
mfc90ud.dll AfxWinMain : [f:\dd\vctools\vc7libs\ship\atlmfc\src\mfc\winmain.cpp Line 47]
nativeExample.exe wWinMain : [f:\dd\vctools\vc7libs\ship\atlmfc\src\mfc\appmodul.cpp Line 33]
nativeExample.exe __tmainCRTStartup : [f:\dd\vctools\crt_bld\self_x86\crt\src\crtexe.c Line 578]
nativeExample.exe wWinMainCRTStartup : [f:\dd\vctools\crt_bld\self_x86\crt\src\crtexe.c Line 402]
The same menu option is also on the Analysis menu
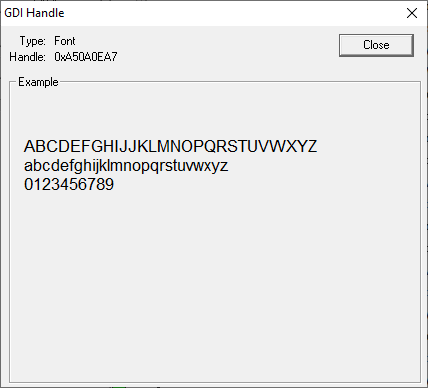
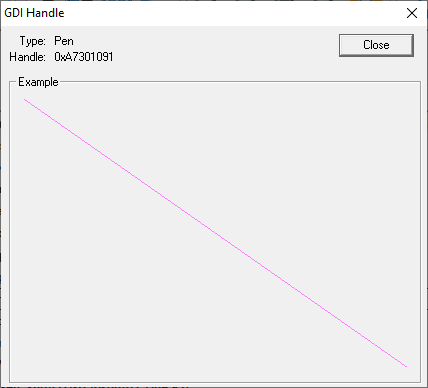
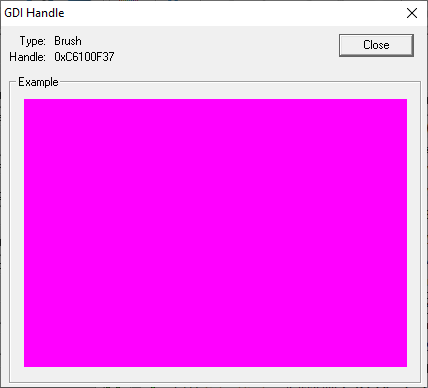
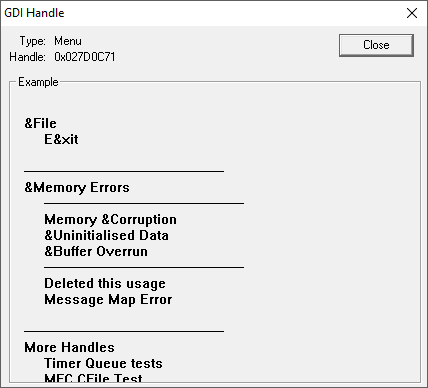
Menu option: showing GDI objects
•Show GDI Object... shows a graphical representation of the GDI object that is selected
A GDI Handle dialog will be displayed showing the handle type, the value and appearance.
This option is only valid for the GDI objects listed below, and only while your application is running as the data will not be accessible afterwards.
•Bitmap |
•Font |
•Palette |
•Menu |
•Brush |
•Icon |
•Pen |
•Window |
•Cursor |
•ImageList |
•Region |
These examples below are from the example application and show a font, icon, pen, brush and menu:
|
||
|
Menu option: show memory byte data...
•Show Data at (bytes)... shows the byte format data at the memory allocation identified by the selected item
The example below shows the memory for a BSTR string shows the address of each 16 byte row, 16 bytes of data and the ASCII text conversion on the right:
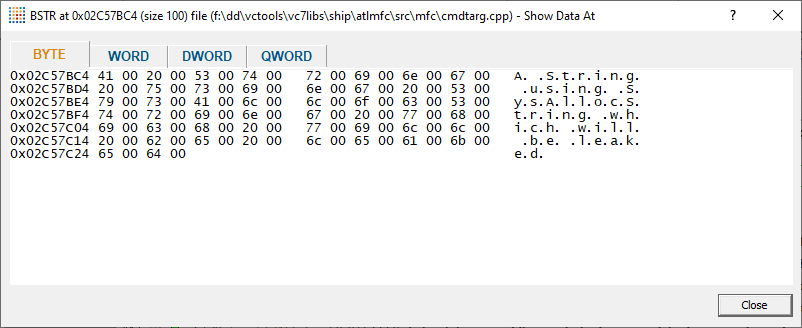
The Options menu for this window lets you update the content and choose whether to colourise data (e.g. uninitialized memory), or to display the memory content as bytes, words or dwords.
•Refresh redisplay updated data
•Colour highlight bytes:
uninitialized data signatures (0xCD)
C runtime heap data guards (0xFD)
deleted memory (0xDD)
Win32 heap values (uninitialized: 0xBAADF00D, deleted: 0xDEADBEEF)
•Bytes displays data as a series of bytes with ascii text representation
•WORDS displays data as WORDs with unicode text representation
•DWORDS displays the data as a series of DWORDs (no text equivalent)
•Exit closes the data window
Showing byte data is only possible whilst the target application is still running
This option is dependent upon having first defined some datatypes or enumerations in the global settings dialog.
These example allocation below uses the data structures from the section on defining a new datatype.
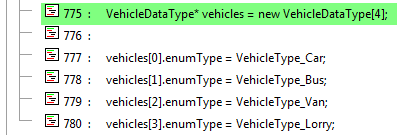
•Show Data at... shows the Show Data At dialog below
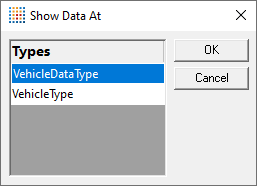
Choose a datatype to use for interpreting the memory contents at the allocation address and click OK.
The allocated memory will be displayed showing values in memory for each data member:
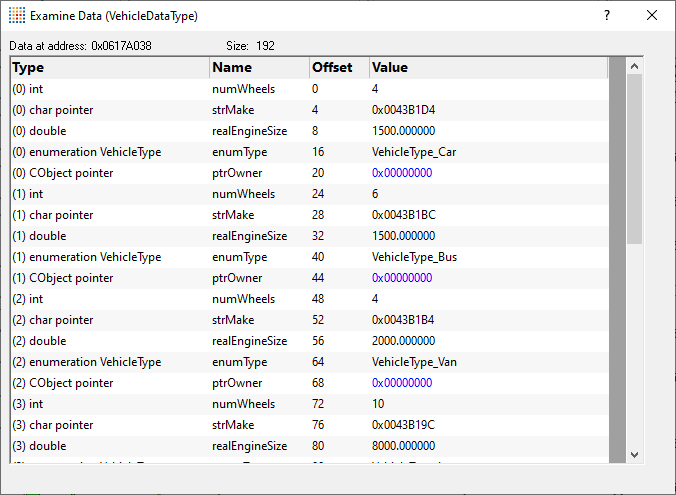
Some values are colour coded to highlight them. For example the NULL pointers in the above image.
Values that are colour coded are values related to NULL, uninitialised memory, deleted memory and damaged memory (buffer overruns and underruns).
Menu options: collapse / expand trace
•Collapse or Expand Trace simply shows and hides data item information, the same as using the or buttons
Menu options: AddRefs & Releases, showing related COM objects
When tracking leaked COM objects it is useful if you can quickly and easily identify operations on the same COM objects.
•Highlight paired AddRefs & Releases highlights all paired AddRef and Release calls
In general, clicking on any AddRef or Release item will display items relating to the same object in the selected object colour.
Menu options: Zero refcount COM objects
•Highlight all COM objects with zero refcount highlights items in the display that are zero refcount COM objects
When you know which objects have a reference count of zero, you know that they have been deallocated.
This means you can concentrate on any COM objects that have not been highlighted, since reference count is non zero.
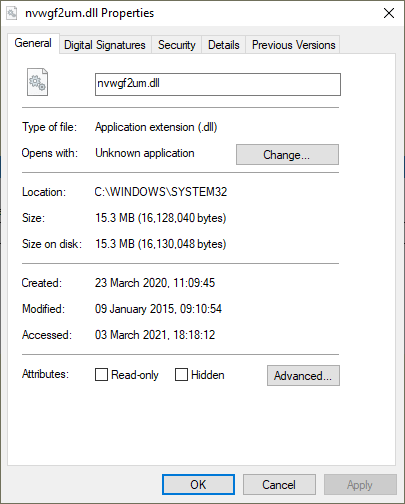
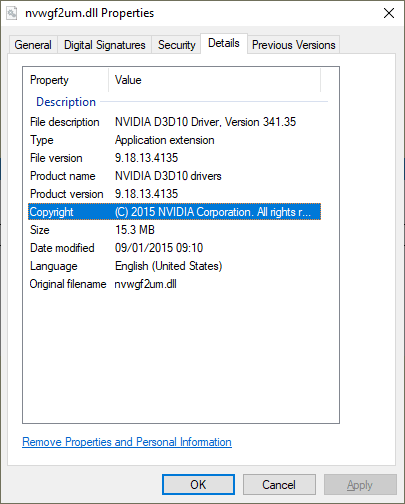
•Properties... display the Windows File Property dialog for the DLL.