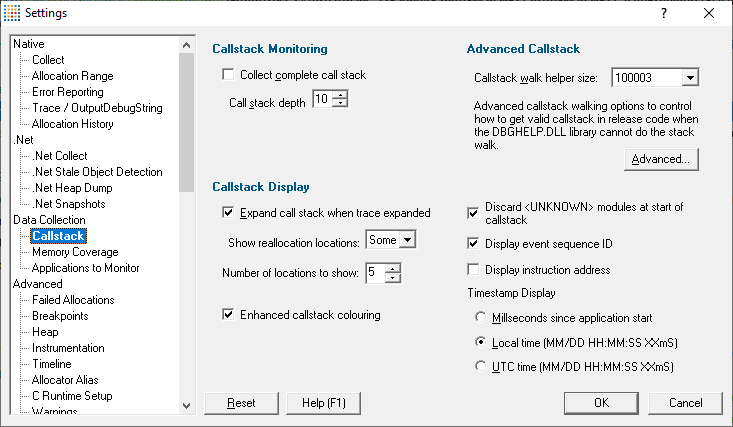
The Callstack tab allows you to specify how the callstack is collected, and how information about it is displayed, via four groups of settings:
•callstack monitoring
•callstack display
•timestamp display
•advanced callstack optimization
The following image shows all the default settings:
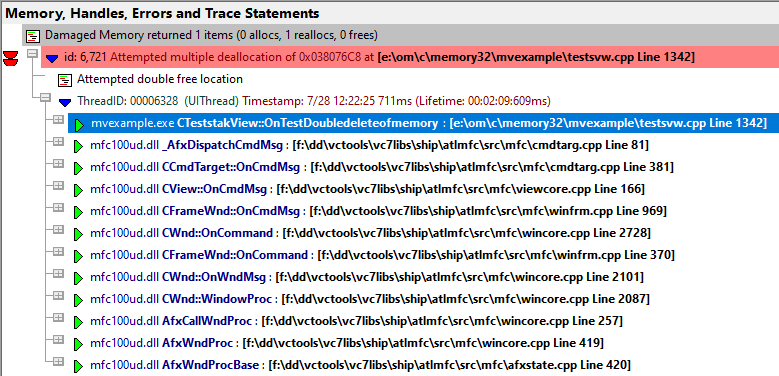
An example of a callstack on the Analysis page:
Callstack monitoring - full or partial callstacks
The Memory Validator stub collects callstacks for each hooked function to display on some of the main tabs such as Memory, Analysis and Pages.
Callstacks can be very long and consume more resources:
•collecting stack traces and converting all the addresses in the stack trace to symbol names takes more time
•collecting longer stack traces makes the target program slower
•longer stack traces consume more memory in the user interface
Opting to collect only part of the stack trace helps reduce that load:
For partial callstacks, deselect Collect complete call stack and set the depth of the callstack as required, using Call stack depth. The default depth is 10.
Otherwise, select Collect complete call stack to collect the entire callstack.
Callstack shorter than expected?
Enhanced callstack colouring
The callstack can optionally be coloured in shades of green to indicate if objects previously allocated (or reallocated) on this callstack have been deallocated or garbage collected.
This colour coding can be used as a hint that memory/handles allocated at this location may not leak.
Here is an example callstack showing the enhanced callstack colouring.
 |
•Enhanced callstack colouring  display callstacks in shades of green when this allocation callstack is known to have been used to create memory/handles that have been deallocated or garbage collected.
Callstack display
The callstack can be displayed with optional parameter names and may be auto expanded when a data item is opened
•Expand call stack when trace expanded When a data item is expanded, the whole recorded callstack will also be expanded
•Show reallocation locations When displaying a stack trace for a reallocation, you can show a sequence of stack traces for previous related allocation locations
This allows you to 'walk' the memory reallocation chain.
The options are Some (with a maximum set below), All or None (disables the feature).
Choosing All, can result in unwieldy data if the reallocation chain is very long.
•Number of locations to show Sets a maximum number of locations when choosing Some above (the default is 5)
•Discard <UNKNOWN> modules at start of callstack hides those unknown items where no useful data can be displayed
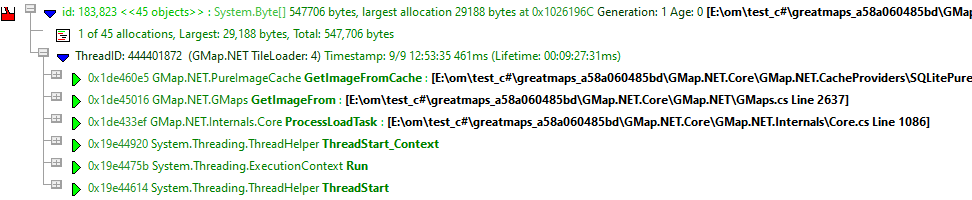
Event sequence ID
•Display event sequence ID Shows each data collection event with an ID that is incremented each time data is collected
Displaying this ID for each data item allows you to see the order in which allocations, reallocations and deallocations are made.
Example of a callstack showing the event sequence id:501:

Changing the display of the event sequence id immediately updates existing displays in the current session.
Instruction address
•Display instruction address Shows or hides the address in memory of each callstack item
Example of a callstack entry showing the address 0x004066d9:

Timestamp display
Each callstack has a timestamp as seen in the screenshot above. You can choose how to display that timestamp:
•Milliseconds since application start Time is displayed in milliseconds only. For example: 3897ms
•Local time (MM/DD HH:MM:SS XXms) Time is displayed as Month/Day Hour/Minute:Second Milliseconds. For example: 11/21 13:16:21 897ms
•UTC time (MM/DD HH:MM:SS XXms) Shows Coordinated Universal Time (Essentially GMT) displayed in the same format as Local time
Reset All - Resets all global settings, including those on the Advanced Stack Walk Dialog (below), not just those on the current page.
Reset - Resets the settings on the current page, including those on the Advanced Stack Walk Dialog (below).
As the title below suggests, the remaining options are for advanced use! An example might be if you find your program has a problem that can be identified, but for which the callstack cannot be collected properly.
Advanced callstack settings
•Callstack walk helper size Specify the size of the cache used to optimize callstack walking
Memory Validator uses a cache to help it optimize the callstack walking process. The cache is used to avoid calling operating system functions to walk the callstack when the result has been previously calculated.
For applications generating many unique callstacks, this size may need to be increased.
All sizes are prime numbers, and the default size is 100003 which is large enough for most applications. If in doubt leave it at the default value of 100003
Callstack walking
Memory Validator provides three different methods of collecting callstacks for functions which you can choose to tailor callstack collection to the task at hand.
1) The standard Microsoft® DbgHelp StackWalk() function
This function is optimised for walking standard Intel i386 stack frames where the EBP register is pushed on to the stack at function entry and popped from the stack when the function exits. This is the typical stack frame for a program built in debug mode.
The DbgHelp StackWalk() function is also capable of reading frame pointer omission data (FPO_DATA) included in a PE file. FPO_DATA is included in optimised binaries that do not use the EBP register to identify the stack frame - this is typical of a program built in release mode.
 Missing data in your callstack? Although Microsoft have provided a very capable stack walking function, there are occasions when the StackWalk() function cannot continue walking along the stack, from one frame pointer to the next. When this happens collected stack traces often appear to have data missing, or look "too short". You may have noticed this when debugging release mode programs in Visual Studio®. Missing data in your callstack? Although Microsoft have provided a very capable stack walking function, there are occasions when the StackWalk() function cannot continue walking along the stack, from one frame pointer to the next. When this happens collected stack traces often appear to have data missing, or look "too short". You may have noticed this when debugging release mode programs in Visual Studio®. |
2) Alternative (custom) StackWalk() function
This method, although slower than Microsoft's stack walker, does not use stack frames to walk the stack, and so enables the stack walker to walk callstacks that DbgHelp StackWalk() cannot.
This is a proprietary method invented by Object Media Limited and licensed to Software Verify Limited.
| What's different about this method? A detailed technical discussion of how this algorithm works is not appropriate here, but suffice to say that all addresses found on the stack are checked for validity, both for code sections, likelihood of CALL instruction taking place, target and source addresses of CALL instructions, removal of duplicate data, and so forth. The resulting callstacks often contain some bogus stack entries, which are obvious to the end user, but not possible to detect by the callstack verification algorithm (this is often due to CALL instructions relying on indirect indexes held in registers which have been changed by the time the stack walker has walked to this point in the callstack - such entries must be taken at face value because they may be valid). |
3) Hybrid of the two
The third stack walk type is a hybrid of the other two.
The first method is used to collect all callstacks. Any callstacks that are too short (defined by a callstack length threshold) then have the callstack collected by the second method.
This provides the speed and power of the standard Microsoft stack walker, with the flexibility to collect callstacks that would otherwise be uncollectible when DbgHelp StackWalk() fails to collect the callstack.
The Advanced Stack Walk dialog shown below is accessed via the Advanced... button and is used to choose one of the three callstack collection options above:
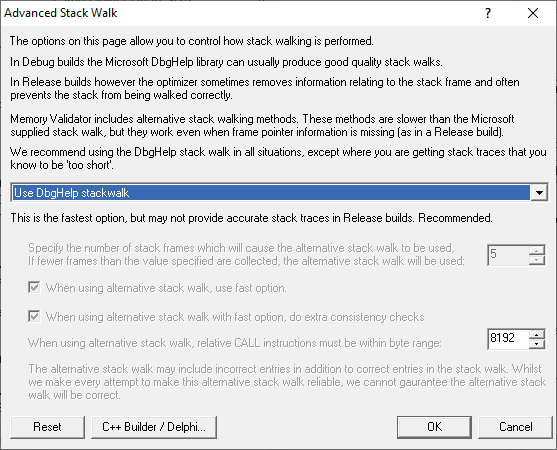
•DbgHelp StackWalk use the DbgHelp.dll StackWalk() function to walk all callstacks
You may have problems collecting some callstacks in release mode programs, and in some special cases in debug programs depending on your program.
•Alternative StackWalk use the alternative stack walking function to walk all callstacks
All callstacks will be collected in both debug and release mode programs, but you may find that some callstacks contain incorrect entries.
•Hybrid StackWalk use the hybrid method outline above
When the alternative stack walk is used you may find that some callstacks contain incorrect entries.
To specify when to use the alternative stack walking function, set a callstack depth.
Any standard callstacks that are shorter than the depth specified, will be collected using the alternative stack walking function.
 See also - recommended usage below
Alternative stack walk method - fast or slow?
•When using alternative stack walk, use fast option uses a faster address verification scheme (recommended) or a slower one
Do extra consistency checks When using the fast option, consistency checks can optionally be performed (recommended) to reduce the amount of incorrect addresses included in the callstack.
Alternative stack walk method - range of relative addresses
When the alternative stack walk is used, relative address CALL instructions have their target address computed to test if the target address is within a threshold of the previous callstack address.
This provides a form of source address to target address integrity to prevent invalid addresses be placed in the callstack.
•Relative CALL instruction byte range set the threshold which the target address must be within, to fine tune the stack walk
A larger threshold reduces the accuracy of the stack walk by allowing too many invalid addresses into the stack.
A smaller threshold reduces the accuracy of the stack walk by rejecting valid addresses from being placed in the callstack.
The default is reasonably large 8192 bytes.
Alternative stack walk method - caveats
When the alternative stack walk is used you may notice some unusual data on the display:
•<UNKNOWN> symbols in the middle of call stacks
This happens rarely, because the address is not valid but for some reason was not rejected by the alternative stack walk.
•Symbols in the middle of callstacks that you know cannot be correct
This may happen because the address is valid, but not for this position in the callstack, and the address passed the alternative stack walk address verification tests - this address was most probably the target of an indirect CALL instruction, and as such, could not be verified.
•Callstacks for data that make no sense
This again is rare, but occurs due to Memory Validator monitoring its own behaviour (which can happen in a few limited circumstances). These callstacks are filtered in both stack walk methods, correctly in the standard one, but not perfectly in the alternative method!
Recommend usage
We recommend that in all situations the stack walking method used is either DbgHelp StackWalk or Hybrid StackWalk.
Only if you find your program has a problem that can be identified, but for which the callstack cannot be collected, do we recommend using Hybrid StackWalk or Alternative StackWalk as appropriate.
C++ Builder / Delphi
If you are using C++ Builder or Delphi to build your applications and you are statically linking the normal method for walking callstacks returns very poor results.
To handle this and allow you to choose between callstack accuracy and speed of execution we've provided the ability to choose the type of callstack walk for both allocations and deallocations. Because deallocation callstacks are less likely to be inspected we think you may wish to choose a less accurate call stack walk for deallocations in return for speed.
The C++ Builder / Delphi Advanced Stack Walk dialog shown below is accessed via the C++ Builder / Delphi... button and is used to choose the stack walk options for allocations and deallocations in statically linked C++ Builder and Delphi applications.
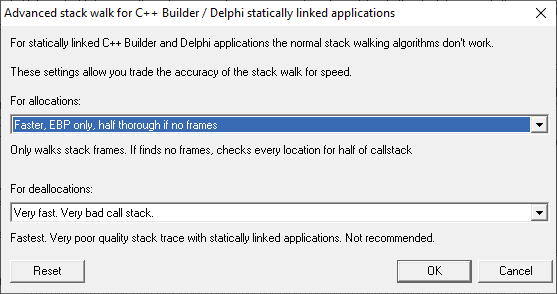
•For allocations choose the callstack walking method for allocations
•For deallocations choose the callstack walking method for deallocations
The values that can be choosen for the callstack walking method are:
•Very fast. very fast stack walks, but mainly return callstacks that are incomplete and inaccurate
•Slow but thorough slow stack walks, checks every location on the stack
•Fast slow stacks walks until a stack frame is found, then walks stack frames, continues checking every location when no stack frames found
•Fast, thorough if no frames same as Fast, but if no frames found also does a Slow but thorough stack walk
•Fast, half thorough if no frames same as Fast, but if no frames found also does a Slow but thorough stack walk for half the stack
•Faster, EBP only slow stacks walks until a stack frame is found, then walks stack frames until no more stack frames
•Faster, EBP only, thorough if no frames same as Fast EBP only, but if no frames found also does a Slow but thorough stack walk
•Faster, EBP only, half thorough if no frames same as Fast EBP only, but if no frames found also does a Slow but thorough stack walk for half the stack
 You may wish to choose a not very accurate callstack method for deallocations as deallocation callstacks are not often inspected when monitoring memory issues.
Reset
The Delphi Advanced Stack Walk dialog has a button labeled Reset at the bottom left of the dialog. This resets only the settings on this dialog back to their default values.
The Advanced Stack Walk dialog has a button labeled Reset at the bottom left of the dialog. This resets only the settings on this dialog back to their default values.