Leak detection
If needed, you can perform in-place leak detection on memory and handles whilst your application is running.
The Leak Detect dialog lets you search for leaks between watermarks or at specific addresses to help narrow the search for large datasets.
 In-place memory leak detection can be time consuming so it's usually more efficient to leave Memory Validator to analyze the collected data once your application has closed normally.
 See the recommended leak detection process at the bottom of this page.
Detecting leaks
To show the Leak Detect dialog, choose the menu option below:
 Tools menu
  choose Leak Detect... displays the Leak Detect dialog
Or use this icon on the Tools toolbar.

The leak detect dialog
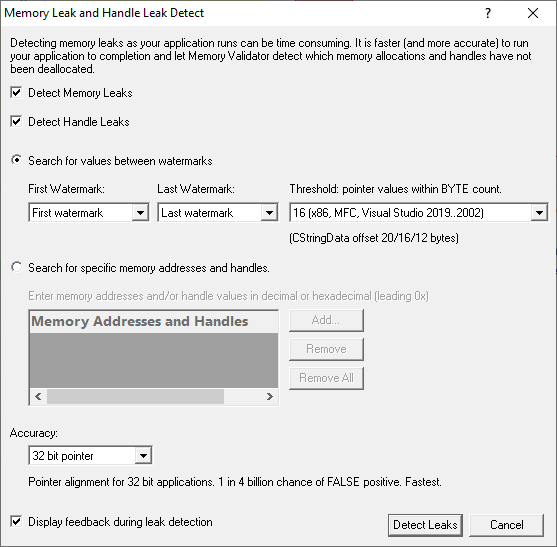
What to search for
The default is to search for both memory leaks and handle leaks
•Detect Memory Leaks detect memory leaks
•Detect Handle Leaks detect handle leaks
You can then choose to search between watermarks or between addresses.
Searching between watermarks
Watermarks are points in the allocation event history that you can mark and use as endpoints for showing data or performing searches
•Search for values between watermarks choose a first and last watermark to search between
•First Watermark set watermark as start marker
•Last Watermark set watermark as end marker
A typical process might be:
•set a watermark
•perform an action in your application that you know is self contained and should not leak
•set another watermark
•search for leaks between the two watermarks
Address threshold searching
When searching between watermarks, (i.e. not searching for a specific address) you can specify a threshold around each memory address.
This is useful because for some data structures, the stored pointer is not the actual allocation memory address.
One example of this is the MFC CString object which uses an internal object CStringData which is allocated with a N byte header which stores information about the CStringData.
The CStringData offset varies with Visual Studio version and processor bit depth:
Visual Studio |
CStringData offset |
x86 VS 6 |
12 |
x86 VS 2002..2019 |
16 |
x64 VS 2008..2019 |
20 |
The pointer that is stored as m_pchData in the CString object is a pointer to the Nth byte in the allocation.
For the reason above, the default is 16 for x86 and 20 for x64, but you can change this:
• Threshold: pointer values within BYTE count set the address threshold between 0 and 63 bytes
If a pointer is found within the threshold range, it's considered a match.
At least 16 bytes is recommended for MFC applications, but you can change this if not using MFC:
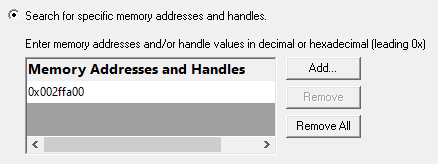
Searching at specific addresses
•Search for specific memory addresses and handles use address or handle ids to search for leaks
The list should be edited to add the memory addresses or handle ids you want to search for.
•Add adds a new item to the list enter the address or id in the new list item
Addresses can be specified in decimal or hexadecimal with a leading 0x and must be positive.
•Remove removes a selected item
•Remove All removes all items
The list is also cleared each time the dialog is shown
Search Accuracy
Most applications will have pointers and handles stored in memory aligned on 4 byte (DWORD) boundaries.
Some Windows datatypes are stored more compactly, and align data on 1 byte and 2 byte (WORD) boundaries.
Your application may have its own datatypes which align data on 1 and 2 byte boundaries.
Depending on the datatypes involved and how they are stored internally, you may wish to specify more accurate address address checking than the 4 byte DWORD alignment that is used by default.
•BYTE boundaries checks addresses and handles on 1 byte boundaries
•WORD boundaries checks 2 byte boundaries
•32 bit pointer boundaries checks 4 byte boundaries
•64 bit pointer boundaries checks 8 byte boundaries. This option is only available with Memory Validator x64.
Byte boundary checking will be slower and possibly find more false positive matches for leaked memory.
Handles are the same size as pointers on 32 bit Windows (4 bytes) and 64 bit Windows (8 bytes).
Starting the leak detection
•Detect Leaks starts the detection process
•Don't Detect Leaks abandon and close the dialog
When searching between watermarks mode, a list of memory allocations and handle allocations (as appropriate) is prepared.
A message dialog shows the number of data items to be checked:
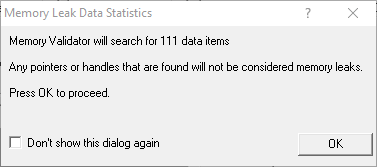
When searching for specific values, no such dialog is displayed as the number of data items is obvious.
A progress dialog indicates what's being examined:
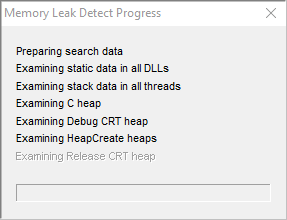
In place leak detection can take a long time.
Memory leak search results
When the search is complete a status dialog is displayed.
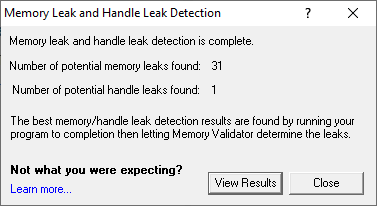
•View Results displays the search results on the Memory and Handle tab.
If pointers to memory can be found in memory or handles can be found in memory they will not be regarded as leaked. Because of this fewer items may be reported as leaked than you may expect. For more information see Why doesn't in-place leak detection always find leaking objects?
Memory leak search results (searching between watermarks)
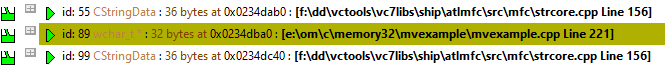
When searching between watermarks is complete, any objects that were determined to have leaked are display in the Memory view.
These objects are given the status 'potential memory leak', and displayed in the relevant colour.
The reason for being a 'potential' memory leak is because the address pointer may (depending on your application) have been
•stored in encrypted format
•offset (as described for CStringData above)
•altered in some other way prior to being stored.
An example portion of the display of potential memory leaks (after using the example application) is shown below:
Memory leak search results (searching for specific values)
When searching for specific values is over, the results are displayed in the Memory Leak Detect dialog:
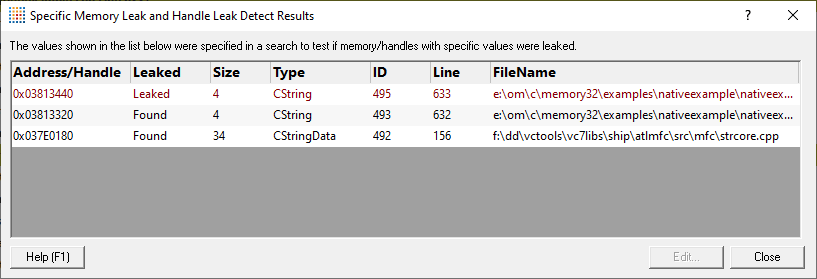
The dialog displays the results in a list showing:
•the memory address or handle value
•if the specified value was found in the application, or was leaked
•the object identified as using the specified address or handle value
This may be blank if no object relating to the value could be determined.
•Edit... (or double clicking any row ) displays the relevant source code in your preferred editor
This is only enabled when you select a result in the list
Why doesn't in-place leak detection always find leaking objects?
When you run the in-place memory leak detection method the only way to detect that memory has leaked (pointer A, let's say) is to search all of your program's memory for pointer A.
If pointer A is not found we can regard that memory as leaked.
However, if pointer A is found anywhere (dynamically allocated memory, static memory, stack variables, function parameters) the pointer must be regarded as valid and cannot be marked as leaked.
The pointer may still be in memory but the program may not be aware of it (so in reality it is leaked) but because it is in memory our scan can't know that the program has forgotten about the pointer.
Consider the following example:
| Show a C++ example (showing some bad programming): |
|
The example uses a simple class container to store some data which has several methods.
The flush method
container uses a method flush() to clear out all data.
flush() can be called at arbitrary times to reset the data.
It is also called from the destructor to ensure that the class cleans up after itself.
However, the flush() method contains a bug: it should call free(data), but doesn't - and so this results in a memory leak.
The test method
If we examine the function test() we can see it calls addData() three times which results in memory being allocated inside the container object.
Finally flush() is called to discard the data, causing a memory leak.
The memory pointer is not freed but is also not reset which means that the pointer data in the object testObj is still pointing to the memory that has been leaked.
This pointer will be found when the in-place memory leak detector scans memory and so the memory will not be regarded as leaked.
This memory will be reported as leaked when the program finishes executing and C++ Memory Validator can reconcile all memory allocations with memory deallocations.
The recommended leak detection process
If in doubt about memory leak detection always use the following methodology:
1.Start your program with C++ Memory Validator
2.Run your program as normal, executing the parts of your program you want to test for memory leaks.
3.Close your program
4.Wait for C++ Memory Validator to analyze all memory allocations and memory deallocations
5.Examine the memory leak report on the Memory tab.