The Types tab summarises all the types of objects in the target program.
 Read on, or click a part of the images below to jump straight to the help for that area.
The left hand side of the view shows controls and a variety of statistics:
The right hand side of the view shows information about event sequence id:
The view lists of all the objects in the program with their type, size and number allocated as well as other information.
You can constrain the displayed objects to those in particular threads or DLLs, and those between watermarks or being tracked by tag trackers.
 Much of the statistics and settings here are also relevant for the Sizes tab.
Types tab
At the top of the Types tab is a set of five more tabs allowing you to change the scope within which objects and types are shown in the table.

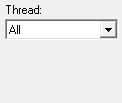
•Thread  show stats for an individual thread in the list or All threads (the default)
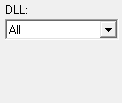
•DLL show stats for a chosen DLL or All of them (the default)
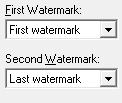
•Watermark filter the display to show objects used between two watermarks
•Tag Tracker display stats for an individual tag tracker or for All trackers
•Tag Tracker Macro shows amalgamated values of all object types in each tag tracker group, allowing overviews of memory use within each tag
Colours used in the display
Each object type's row is coloured according to whether the object has:
 an increasing count
 a decreasing count
 a static count - i.e. not recently changed
 a zero count
The importance of each value within most of the columns is highlighted with a percentage bar:
 the object type with the maximum value in a given column
 relative contribution of the object value in each column
See also the Data Highlighting dialog to customise the first two colours.
The data columns
The data in each column is summarised below and described in more detail further down, with the help of examples.
Some of the header columns display a total for the column underneath the column name.
•Type •R Size •C Size •Count •Max •Cumulative •% R Size •% C Size •% Objects •R Total •C Total •Seq 1 •Add Seq •Del Seq •Cur Seq •Activity |
object type running allocation size cumulative allocation size number of live allocations maximum number of live allocations cumulative number of allocations size as percentage of total running allocations size as percentage of total cumulative allocations object count as percentage of total number of objects running total size (R Size x Count) cumulative total size (C Size x Cumulative) sequence id of first allocation of this type id of most recent allocation id of most recent deallocation id of most recent allocation or deallocation the span between first and most recent event sequence ids |
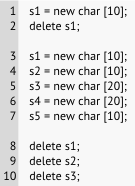
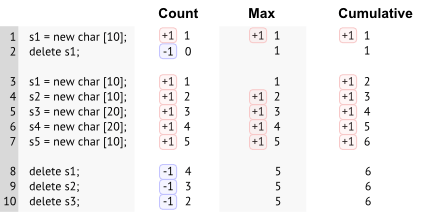
To best explain the numbers in each column we'll use a simple example scenario which has a series of char[] allocations and deallocations shown in order of their event sequence id.
This event sequence below (not actual code) will be used to demonstrate how some of the figures in the columns would change with each event. Note this would leak allocations s4 and s5.
Type
The type is simply that of the memory allocation, determined by parsing the source code at the allocation location, eg char[] in our example above.
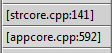
When a type cannot be determined, a pseudo-type is created by merging the filename and the line number for the allocation:
About Running and Cumulative values (R & C)
Some of the columns make reference to R or C values.
Running (R) values increase with each allocation and then decrease with deallocations, thus giving a snapshot of the live or current state.
Cumulative (C) figures only ever increase, ignoring deallocations, so give a quantitative extent of overall or historical activity.
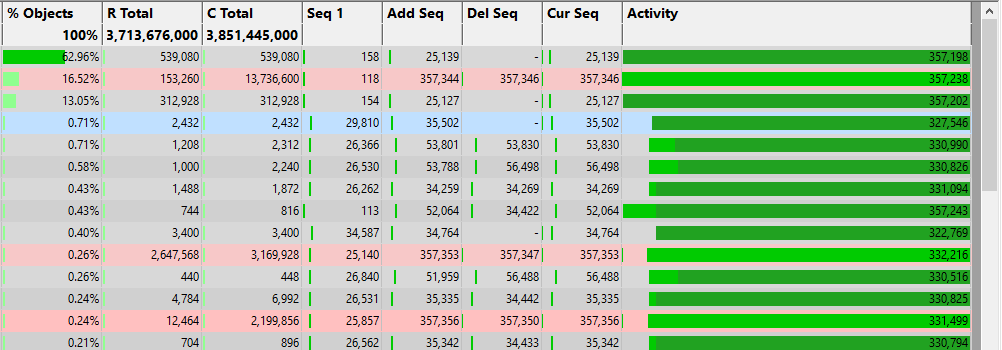
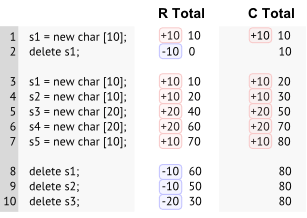
R Total and C Total
Although not first in the column order, these two values are used to calculate some of the other column values.
•R Total the running total gives the total size of all live objects of each type
•C Total the cumulative total tells you how much of each type has ever been allocated
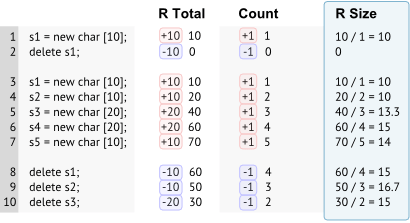
R Size and C size
•R Size the running size for each object type is R Total / Count - i.e. the average size of all live objects
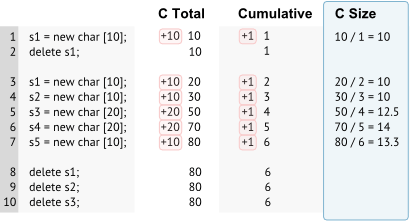
•C Size the cumulative size for each object type is C Total / Cumulative - i.e. the average size of all allocated objects whether live or freed
For objects with a fixed size these values will both always be the size of the object.
Objects with an average size calculation have the value prefixed with (Av.):

Count, Max and Cumulative
•Count the number of live objects of each type, so in our example the count increases and decreases, resulting in an overall increase of 2
•Max the maximum value that the count ever reaches - i.e. the peak number of live objects at any one time
•Cumulative increases with every single allocation, giving a historical total.
Percentage contributions: % R Size, % C Size and % Objects
The percentage figures give an indication of how important each type is relative to others:
•% R Size the percentage of total live object sizes represented by each type i.e. the contribution of R Total for each object to that of all object types combined
•% C Size similar to above but for cumulative figures - the contribution of each C Total to that of all object types combined
•% Objects the contribution of each object count to the combined counts of all objects
Sequence numbers: Seq 1, Add Seq, Del Seq and Cur Seq
The sequence numbers show significant event sequence ids relating to each object type:
•Seq 1 the first allocation sequence id for each object type
•Add Seq the sequence id for the most recent allocation
•Del Seq the sequence id for the most recent deallocation
If no objects of a type have ever been deleted, the value just shows a hyphen
•Cur Seq the most recent event sequence id related to each object type - usually the greater of Add Seq or Del Seq
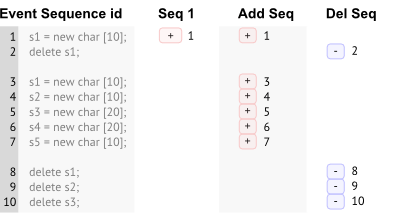
Looking at the values for the range Seq 1 to Cur Seq helps give an indication of the span of activity of each object type.
Event sequence id markers
The four sequence id columns show markers visualizing the event's position relative to the the total number of events so far.
Each row shows green markers denoting the relative position of the first and most recent sequence ids for the object type.
In the following example there have been approximately 3000 events to date:
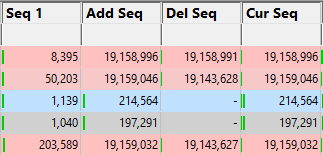
These markers can help you see the relative timing and order of object type allocation and deallocation much more quickly than scanning through the numbers alone.
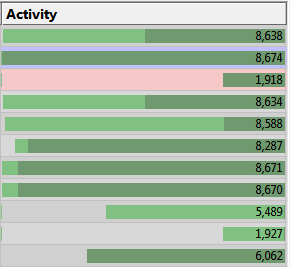
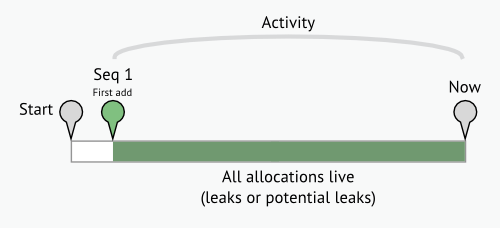
Object activity
The 'activity' of an object type is the span between its first allocation id and the most recent event sequence id at which at least one object was still live.
The Activity column in the view shows a graph of that lifespan, with the value being the number of events spanned:
Below are some examples of what the activity graph means, where:
•Start corresponds to the first known event in the target program
•Now indicates the most recent event sequence id for any event in the target program
Example 1: Some objects of the given type have been allocated, but none freed
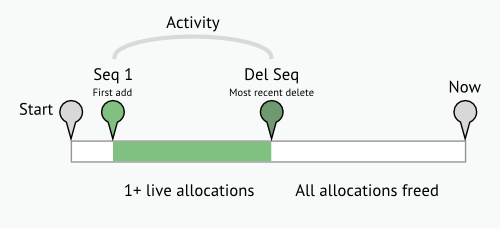
Example 2: Some objects of the given type have been allocated, and all have been freed
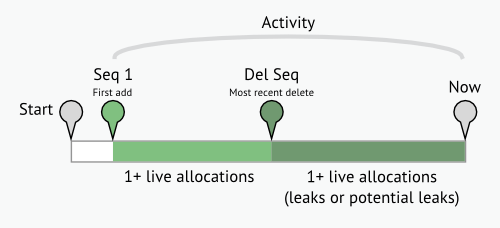
Example 3: Some objects of the given type have been allocated. Some of those have been freed, but not all
Sorting columns
Sorted columns are shown yellow. Just click on the column header to change the sorting column or it's sort direction order.
The sorted column takes effect in each of the five object tab views, Thread, DLL, etc.
Each of the five object tab views has different options at the top, with Tag Tracker Macro having none.

The first two tabs allow you to choose a single Thread or DLL for which to show object types used.
The Memory tab topic describes use of the Watermark and Tracker options in detail.
The following options are common to all five tabs:
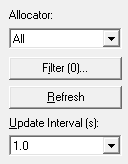
Updating the display
•Refresh updates the display - as does the  button on the Tools menu and toolbar
With an update interval set to Never, you'll need to use this Refresh button to update the display.
•Update Interval (s) automatically updates the display at your choice of interval between 0.1 and 60 seconds - or never!
Allocator
•Allocator updates the display to show types allocated by the specified allocator
The allocator can be one of the values in this table. The default is All.
All |
All types |
All Native Memory |
All native memory types |
All Native Handles |
All native handle types |
All .Net |
All .Net types |
CRT |
All types from CRT allocations |
HeapAlloc |
All types from HeapAlloc allocations |
LocalAlloc |
All types from LocalAlloc allocations |
GlobalAlloc |
All types from GlobalAlloc allocations |
SysAllocString |
All types from SysAllocString allocations |
CoTaskMemAlloc |
All types from CoTaskMemAlloc allocations |
IMalloc |
All types from allocations tracked by IMalloc |
NetAPI |
All types from NetAPI allocations |
Misc |
All types from Misc allocations |
VirtualAlloc |
All types from VirtualAlloc allocations |
VirtualAllocEx |
All types from VirtualAllocEx allocations |
VirtualAllocVlm |
All types from VirtualAllocVlm allocations |
User Defined (API) |
All types from allocations reported by the User Defined Types API |
Custom Hook |
All types from allocations tracked by the Custom Hooks settings |
COM |
All types from COM allocations |
Com AddRef |
All types from COM AddRef tracking |
OpenGL |
All types from OpenGL allocations |
Crypt |
All types from Crypt API allocations |
Handles |
All types from handles not represented by other allocators in this list |
GDI Handles |
All types from GDI handle allocations |
USER32 Handles |
All types from USER32 handle allocations |
Internet Handles |
All types from internet related allocations (socket, WinHttp...) |
Printer Handles |
All types from WinSpool allocations |
Fortran |
All types from Fortran allocations |
Delphi |
All types from Delphi allocations |
.Net Objects |
All types from .Net objects |
.Net Large Objects |
All types from .Net large objects (>= 85,000 bytes in size) |
.Net Handles |
All types from .Net handles |
.Net VTables |
All types from .Net VTables |
Local filters and settings
•Filter... shows the local filters dialog for the types tab, allowing you to fine tune what is included or excluded from the display
The filter button also indicates the number of local filters, although not all of these may be enabled
See also the popup menu options to create filters based on the selected object type
See the Data Highlighting settings dialog to set the appearance of rows in the table depending on the object count and whether it's increasing or decreasing
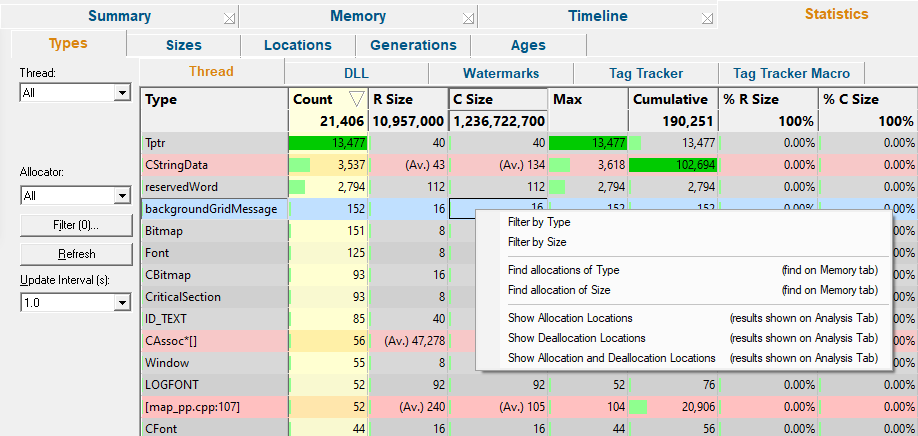
Types view popup menu
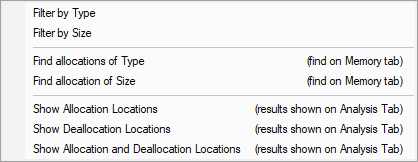
The following popup menu is available over the data area to allow filter creation or data drill-down.
Menu option: Filters
•Filter By Type creates a filter using the selected object type, so that it is removed from the view
•Filter By Size creates a filter based on the size of the selected object so all rows with an object type of this size are removed
Filters created this way are added to the local filters dialog where they can be modified or removed.
 Filters apply to each of the five object tabs and do not affect the values in each column - only whether the object type is actually shown in the view.
Menu option: Finding types - drilling down into the data
•Find allocation of Type searches the Memory tab for allocations of the selected type
Menu option: Finding sizes - drilling down into the data
•Find allocation of Size searches the Memory tab for allocations of the selected size
Menu option: Showing locations - drilling down into the data
The following three options all open the Analysis Tab, adding a callstack for every allocation or deallocation of the selected object type.
This enables a deeper inspection of where and how instances of an object type is allocated or freed.
•Show Allocation Locations shows allocations only
•Show Deallocation Locations shows deallocations only
•Show Allocation and Deallocation Locations shows both
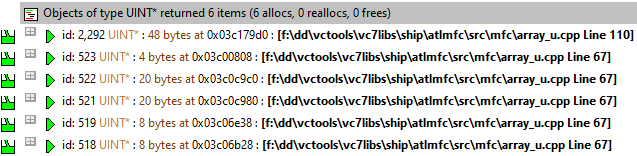
For example, showing allocations for the following row in the Types tab will show the callstacks for six allocations of various sizes in the Analysis tab below: