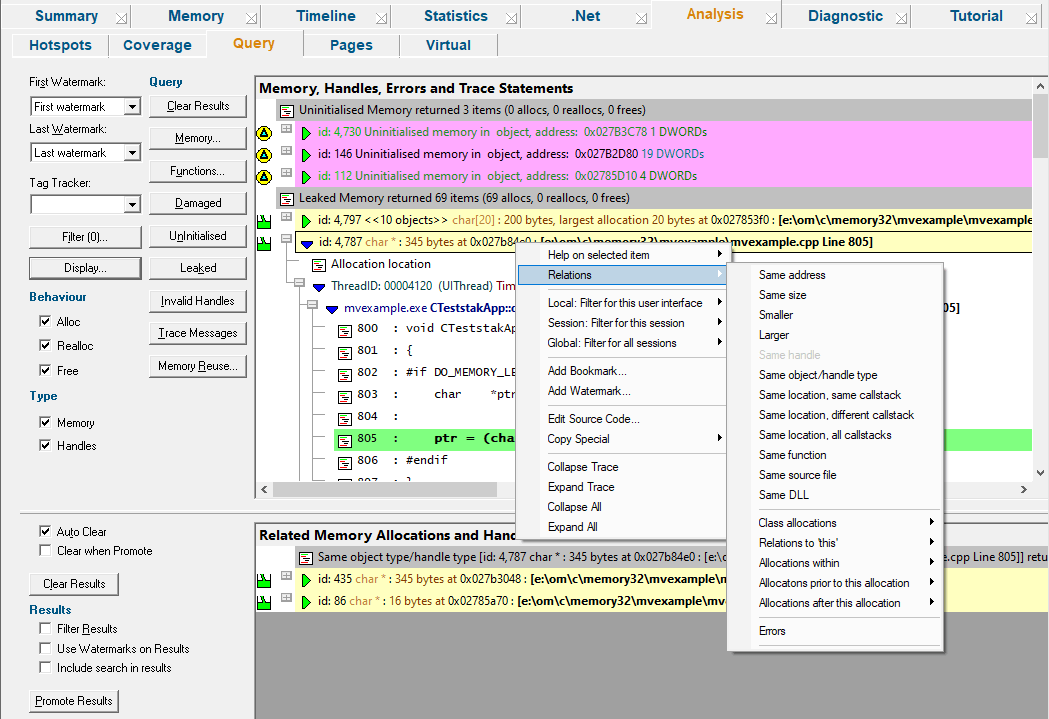
The Query tab shows groups of search results and allows you to find many types of related data for different memory allocations.
 Click a part of the image below to jump straight to the help for that area.
If you've read the previous sections then you'll probably have seen menu options referring to showing results here on the analysis tab.
Think of the analysis tab as a basket where you can send groups of data to inspect at your leisure.
That data will appear in the upper of the two resizable windows and becomes your working data from which you can also find related allocations to display in the lower window.
The Analysis Data
Both the upper and lower views show data in the same format as that found in the Memory tab's collected data.
Each line has an icon at the left, indicating its type, and has an explanatory tooltip:

The text on each line is the same and indicates:
•datatype (if known)
•size
•allocation address/handle value
•source file and line number (if available) where the allocation occurred
•an optional event sequence id at the beginning of the line
The background colour for each line indicates the status of the data - eg, leaked, damaged, or uninitialized.
To edit the source code, double click on any part of the lines of source code displayed or use  Edit Source Code...
The upper window - working data
The upper window will contain any data sent from other tabs or results of queries made via the buttons at the left.
This becomes your working data, and will grow (with a header line between each group) as each set of results is added.
Using the relations option on the popup menu, you can then find related allocations or objects which are displayed as separate results in the lower window.
The lower window - results within results
Having obtained related data in the lower window you can inspect it in the same way, filter it and promote it back up to the top window.
Navigation shortcuts
Two navigation keyboard shortcuts are provided. They collapse the current entry, move to the next or previous entry and then expand that entry to show the full callstack.
To move to the previous top level entry press 

To move to the next top level entry press 
Analysis tab options - upper window
At the far left of the window are the now familiar options for filtering data using the the Watermark and Tracker methods outlined for the Memory tab.
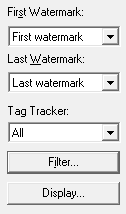
Also familiar, are the filter and display settings:
•Filter...  shows the local filters dialog for the memory tab
The filter button also indicates the number of local filters, although not all of these may be enabled
•Display... shows the Analysis Display Settings dialog
Unlike other tabs, there are no options to update the display here, since the data is always static.
Instead, there are options to change the type of memory allocation you are interested in, and these will only take effect on any new queries added to the display.
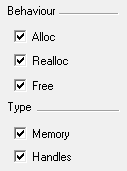
•Behaviour choose to show memory that has reached one or all of the allocation, reallocation and deallocation stages
•Type choose to show query results for handles, or memory as per the above behaviour, or both
•Clear Results removes all working data from the upper window only as the lower window has its own clear button
Running data queries
The data in the analysis tab is not limited to that sent from other tabs.
From the buttons at the left you can run some common or very targeted queries to search for allocations, reallocations, and deallocations of memory and resource handles.
Custom queries
Several of the main tabs have some comprehensive methods of querying memory or functions, and which are accessible from the main query menu and query toolbar.
The Analysis tab has dedicated buttons for two of these queries:
•Memory... Shows the Find Memory dialog to use a wide range of search criteria to find memory
•Functions... Shows the Find Functions dialog but displays the results here in the analysis tab
Predefined queries
There are a selection of common predefined queries available at a single click:
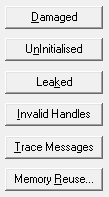
•Damaged finds all damaged memory allocations, such as overwrite, underwrite, double delete, etc
•Uninitialised shows any detected uninitialised memory if you've switched these hooks and settings on
•Leaked finds all leaked locations, memory and handles still in use after the application has exited
•Invalid Handles finds all invalid or NULL handles
•Trace Messages shows any trace messages if you've switched the trace hook setting on
Memory reuse
Memory re-use is not necessarily an error, in fact it almost certainly isn't, as the allocator will provide previously freed memory addresses as memory allocation addresses.
For certain bugs, memory corruption being an example, you may be interested in knowing which locations allocated memory allocations at a particular address,
and if that address has been re-used. These are targets for further investigation.
•Memory Reuse searches for reused memory in the application
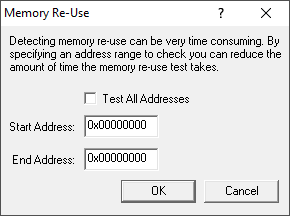
Because search through all memory may take a long time in a large and active application, you can instead opt to search within a range of memory:
The start and end addresses for the memory range can be entered in decimal or hexadecimal format with the leading 0x
 Note that some libraries outside your control may reuse memory, so be aware that not all results found are necessarily errors in your application.
Analysis tab options - lower window
The lower window has it's own comparatively simple set of options:
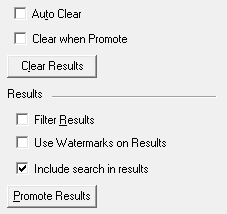
•Auto Clear clears the lower window before adding a new relations search from the upper window
•Clear when Promote clears the lower window when promoting these results to the upper window
•Clear Results simply empties the lower window
•Filter Results optionally filters the lower window data using the same filters as the upper window
•Use Watermarks on Results applies the upper window's watermark settings to the lower window
•Include search in results brings the upper window item that initiated the relations search along with the results
•Promote Results pushes all or selected lower window results into the upper window, optionally adding to or replacing what's there already
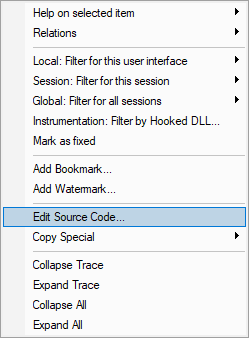
Analysis view popup menu
The following popup menu is available over the upper window.
Menu option: data item summary
•Help on selected item the sub-menu shows a simple one line description of the selected entry:

Menu option: relations
The relations menu has a large sub-menu with many different options for choosing a set of related data to display in the lower analysis window.
Think of this as a sub-query on the working data - like searching for friends of friends on a social network!
Given an entry in the upper window, available relations are as follows, with allocations generally meaning any allocation, reallocation or deallocation
•Same address •Same size •Smaller •Larger |
Finds any other allocations on the same memory address, for example previous allocations or frees Allocations on any memory objects of identical size or on smaller or larger objects |
|---|---|
•Same handle |
Finds any other allocations of the same resource handle |
•Same object/handle type |
Finds any other allocations of the same type |
•Same location, |
Finds other allocations made at the source code location: different callstacks or any callstack |
•Same function •Same source file •Same DLL |
All allocations from the same function... or the same file or the same DLL |
•Class allocations |
All allocations, reallocations or deallocations from the same C++ class |
•Relations to 'this' |
Finds various other events relating to the selected object:
Allocator of this - only for reallocated objects Reallocation of this Reallocation of this address at same address Reallocation of this address at different address Deallocation of this Allocations, reallocations, deallocations Referenced by this - these two need the target application to still be running Referencing this |
•Allocations within |
For memory allocations, finds all other allocations within a range of 32 bytes up to 4Kb of this one |
•Allocations prior •Allocations after |
For memory allocations, finds the previous 5, 10 or 20 allocation events or the next 5, 10 or 20 events |
•Errors |
Shows any known damaged memory allocation information relating to this entry |
Menu option: filters
The filter options here are identical to that of the Memory tab menu options.
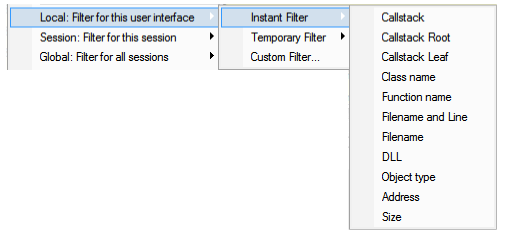
The three filter options on the menu let you create different types of filters at different scopes, using various attributes of the selected data item.
The types and scopes of filters in Memory Validator are described in detail elsewhere, but here's a quick summary:
•Local filters affect the current tab only and are managed locally via the filters button
•Session filters affect all tabs until the end of the session, and are saved with sessions
•Global filters affect all tabs, and are persistent between sessions until removed from the global filters
For each scope, you can create instant, temporary or custom filters:
•Instant quick and easy - this uses the selected data item and requires no further input from you
•Temporary like instant filters but not saved with any session data
•Custom allows you to define the characteristics of the filter
Finally - for each scope and type of filter, you can use any of the following elements of the selected data item as the filtering characteristic:
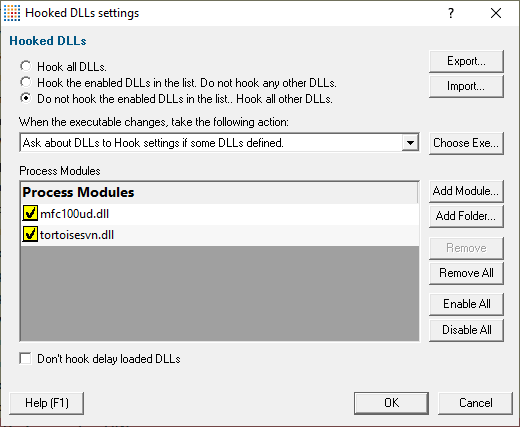
A fourth option allows you to filter the next run by DLL, either excluding that DLL, or including that DLL, in the list of DLLs that will be monitored.
The Hooked DLLs settings dialog is displayed.
Menu option: mark as fixed
•Mark as fixed marks the selected item as "I have fixed this"
To remove the marking from the event press the shift key at the same time you choose Mark as fixed on the menu.
Items that have been marked as fixed are shown with a line struck through them.

This allows you to easily identify items that you've worked on and items that have yet to be worked on.
The mark as fixed status is permanent, will display on all user interfaces that display events, and will persist across saving and loading sessions.
Menu option: editing source code
•Edit Source Code... opens the default or preferred editor to edit the source code
The copy special sub-menu lets you copy to the clipboard any of the following attributes, (or all the information):
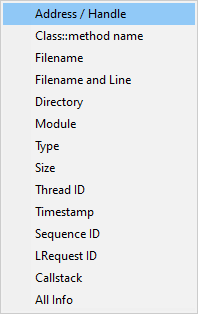
See the same option on the Memory view menu for more information.
Menu option: bookmarks and watermarks
Bookmarks allow you to find a data item easily at a later date, while watermarks are used above to show only those items between two points in time
•Add Bookmark... adds a bookmark for the selected item
•Add Watermark... adds a watermark for the selected item
Menu options: collapse / expand trace
•Collapse or Expand Trace simply shows and hides data item information, the same as using the  or
or  buttons
•Collapse All completely collapses all data items in the upper window, including any source code views that were open
•Expand All expands all data items down to but not including the source code snapshots