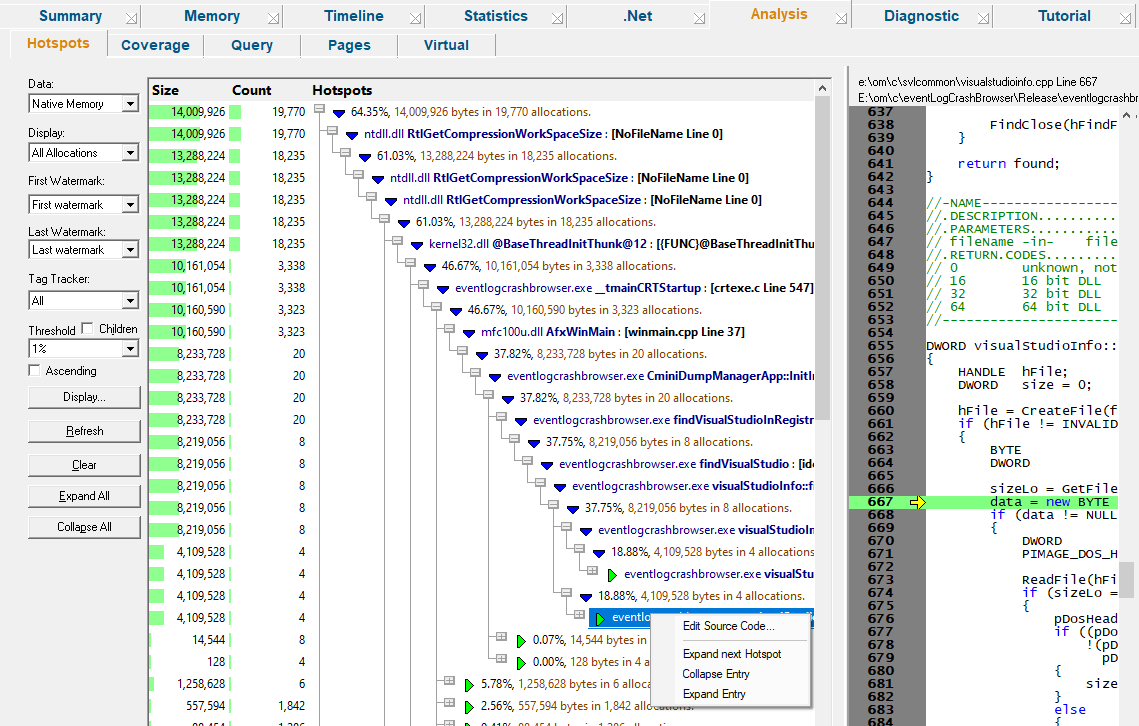
The Hotspots tab displays areas of high memory and handle allocation activity.
 Read on, or click a part of the image below to jump straight to the help for that area.
Memory hotspots are locations in the target program that are responsible for the highest allocation of memory or handles.
This view displays those hotspots that have a contribution to the total allocated memory, which is greater than the threshold setting below.
The tab is split into two resizeable halves, with the left showing the hotspot callstacks and the right showing the source code for any selected row on the left.
Hotspot display styles
At the top of the Hotspot tab is a combo box containing a list of many display styles, allowing you to choose what data to examine.
•Native Memory  hotspot data for native memory allocations
•Native Handles hotspot data native handle allocation hotspots
•.Net Memory hotspot data for .Net memory allocations
•.Net Handles hotspot data .Net handle allocation hotspots
•All Memory hotspot data for all native and .Net memory allocation hotspots
•All Handles hotspot data for all native and .Net handle allocation hotspots
•All Native hotspot data for all native memory and handle allocation hotspots
•All .Net hotspot data for all .Net memory and handle allocation hotspots
•All hotspot data for all native and .Net memory and handle allocation hotspots
The left side of the tab shows three columns of data:
•Size total size of memory or handles allocated within the hotspot area
•Count how many allocations were made within the hotspot
•Hotspots a hierarchical view of the function calls leading to each hotspot location
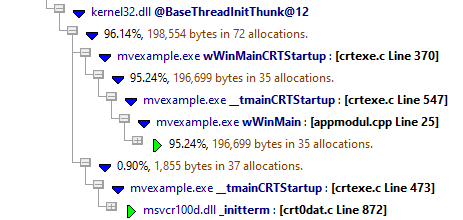
Hotspot function call hierarchy
To reduce the amount of repeated information, allocations sharing a partial callstack are merged together in the hotspot function call hierarchy.
As you expand each node in the tree, it shows the function, file and line number, although you can show more via the display settings.

Intermediate nodes indicate the function's percentage contribution to the total allocation, along with the size and count information.

These intermediate nodes are only shown at and after the branches, i.e. where a function splits the allocations between different child callstacks.
Source code
A short section of the source code around the highlighted allocation line is shown at the end of the callstack.
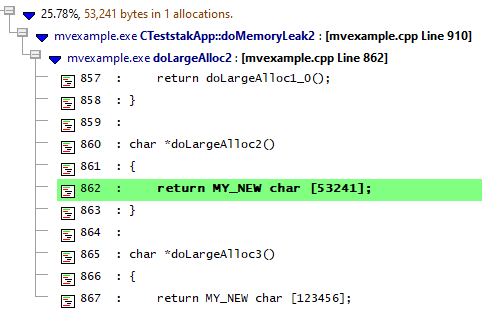
You can browse the whole source file (if available) on the right when you click on any row in the hierarchy.
If you want to edit rather than browse, double clicking a row will open the relevant source code file for editing, using the editor of your choice.
Similar to the other tab pages, a set of options are found on the left, that control the data displayed in both the memory and the handles hotspot views.
The choice of lifetime or live data, and the setting of the hotspot threshold are specific to the hotpot tab.
You can choose to display all recorded allocations or just the live ones.
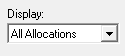
•All allocations shows cumulative data for all allocations, reallocations and deallocations and associated hotspots
•Current allocations shows only the live data that has not been freed, and the current hotspots
If the program has ended, this will be the leaked memory, enabling you to see leak hotspots.
Be sure to click Refresh after changing this option and others.
Reducing data with watermarks and tag trackers
As with other tabs, you can restrict displayed data to that between two watermarks, or allocations associated with particular tags.
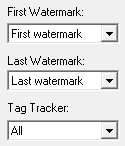
The Memory tab topic describes use of the Watermark and Tracker options in detail.
Contribution threshold
The threshold of whether a location is regarded as a 'hotspot' is determined by the percentage contribution to the overall consumption of memory or handles.
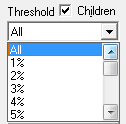
•All shows the hotspot hierarchies incorporating all allocations, barring any filtering via watermarks, tag trackers etc
•X% display only hotspots that contribute at least that much to the overall resources
•Children controls whether hotspots use sub allocations in the hierarchies to meet the hotspot percentage criteria
Sorting
The data on the display can't be sorted, but you can change the ordering direction
•Ascending swaps the ascending or descending ordering of the hotspots. Don't forget to Refresh!
Local filters and settings
•Display... shows the Hotspot Tab Display Settings dialog to set the types of data and messages displayed in the hotspot view.
Updating the display
•Refresh updates the display - as does the  button on the Tools menu and toolbar
•Clear removes all data from the display
This reduces Memory Validator's own memory usage. If you have lots of data but low memory on your computer, clearing one view before using another view may help.
•Collapse All completely collapses all hotspot data items, including any source code views that were open
•Expand All expands all data items down to but not including the source code snapshots
Hotspot view popup menu
The following popup menu is available over the data area
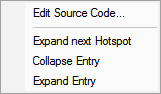
•Edit Source Code... opens the default or preferred editor to edit the source code
•Expand next hotspot expands the hierarchy only as far as the next hotspot, but not the source code snippet
•Collapse entry collapses the selected hierarchy of hotspots
•Expand entry expands all hotspots in the selected hierarchy