The Memory Tab Display Settings control the memory, handles and messages displayed on the Memory tab.
The default options are shown below:
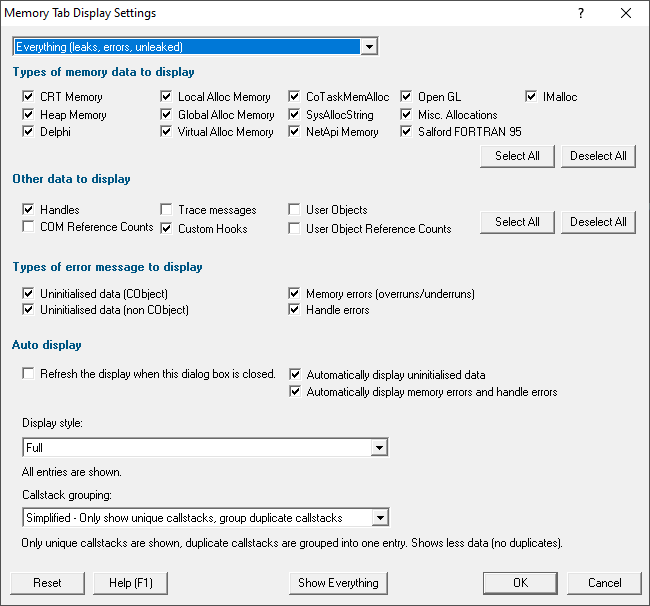
 Note that these settings control what is displayed, not what is collected. The data collection settings may have more information about some of the settings below.
Display categories
The combo box at the top of the dialog controls the broad categories of what is displayed, the other sections of the settings dialog provide more find grained control within the broad categories.
Choosing a display category can be a really useful way to quickly simplify the display to just a few items. For example just showing the errors, so that you don't have to wade through 1000s of leaked data reports to find the more serious errors.
•Everything  all data is displayed
•Leaks and errors items that are leaked (or potentially leaked) and errors are displayed
•Leaks items that are leaked (or potentially leaked) are displayed
•Errors items that are errors are displayed
•Unleaked items that are not leaked and not errors are displayed
Note that even though you've chosen a broad category (for example Everything) the other criteria on this dialog also have to be satisfied in order for the item to be displayed.
Types of memory to display
Setting |
Displays memory that is not deallocated and was allocated by... |
•CRT memory |
CRT memory |
•Heap |
the HeapAlloc() group of functions |
•Delphi |
Delphi's allocation functions |
•Local Alloc |
the LocalAlloc() group of functions |
•Global Alloc |
the GlobalAlloc() group of functions |
•Virtual Alloc |
the VirtualAlloc() group of functions (see below) |
•CoTaskMemAlloc |
the CoTaskMemAlloc() group of functions |
•SysAllocString |
the SysAllocString() group of functions |
•NetApi |
the NetApi group of functions |
•Open GL |
the OpenGL group of functions |
•Misc |
various other memory functions that allocate and manage memory |
•Salford FORTRAN 95 |
Salford Software's FORTRAN 95 allocation functions |
•IMalloc |
the IMalloc() interface |
Using VirtualAlloc?
Note that your call to VirtualAlloc/VirtualAllocEx should include the flag MEM_RESERVE or MEM_COMMIT.
If including MEM_COMMIT without MEM_RESERVE the first page of the proposed address range should be non-reserved or your proposed address should be NULL allowing the operating system to choose the address for you.
Other data to display
Setting |
Displays... |
•Handles |
handles that have not been deallocated |
•COM Reference Counts |
COM Objects and reference counts (Query Interface, AddRef, Release) that Memory Validator is aware of |
•Trace Messages |
TRACE() and OutputDebugString() messages received by Memory Validator |
•Custom Hooks |
memory allocated by custom memory allocation functions |
•User Objects |
memory allocated by the user defined allocation functions which has not been deallocated |
•User Object Reference Counts |
reference counts received from the user defined reference count function |
Error messages
Setting |
Displays... |
•Uninitialized Data |
memory marked as uninitialized and derived from CObject |
•Uninitialized Data |
memory marked as uninitialized and not derived from CObject |
•Memory Errors |
memory marked as damaged due to an overrun or underrun |
•Handle Errors |
attempts to use handles incorrectly (passing them to the wrong functions) |
Auto
Setting |
Displays... |
•Automatically Display |
uninitialized data information received by Memory Validator |
•Automatically Display Memory Errors |
memory damage data information received by Memory Validator |
Other settings
Setting |
Displays... |
•Display style |
how much information is displayed on the screen |
•Callstack grouping |
display all callstacks or just unique callstacks |
•Refresh the display when this dialog box is closed |
updates when this settings dialog is closed |
The display style can be one of the following values:
•Full information about every allocation and error is displayed (unless filtered)
•Simplified - your source code at root Only traces that have a callstack with your source code at the top of the callstack are displayed
•Simplified - your source code not at root Only traces that have a callstack with your source code in the callstack (except for the top position) are displayed
•Simplified - your source code anywhere Only traces that have a callstack with your source code anywhere in the callstack are displayed
•Simplified - compiler vendor source code at root Only traces that have a callstack with your compiler vendor source code at the top of the callstack are displayed
•Simplified - compiler vendor source code not at root Only traces that have a callstack with your compiler vendor source code in the callstack (except for the top position) are displayed
•Simplified - compiler vendor source code anywhere Only traces that have a callstack with your compiler vendor source code anywhere in the callstack are displayed
•Simplified - no source code Only traces that have a callstack with no source code are displayed
The callstack grouping can be one of the following values:
•Full every callstack is shown
•Simplified - Only show unique callstacks Traces that share the same callstack are displayed once. A summary is shown indicating the number of allocations, how many bytes in those allocations and the size of the largest allocation.
Reset
•Reset resets all the display related settings for this tab