The Coverage tab lets you find untested parts of your program's memory and resource allocation.
If the Coverage tab isn't visible, use the Data Views menu to set which views are shown.
 Read on, or click a part of the image below to jump straight to the help for that area.
Using the coverage information
Inspecting the coverage tells you which memory allocation, reallocation and deallocation locations are or are not being tested, including resource handles.
Understanding the coverage helps you plan and improve your regression tests to include areas of code that allocate memory or deallocate memory but are not yet being visited.
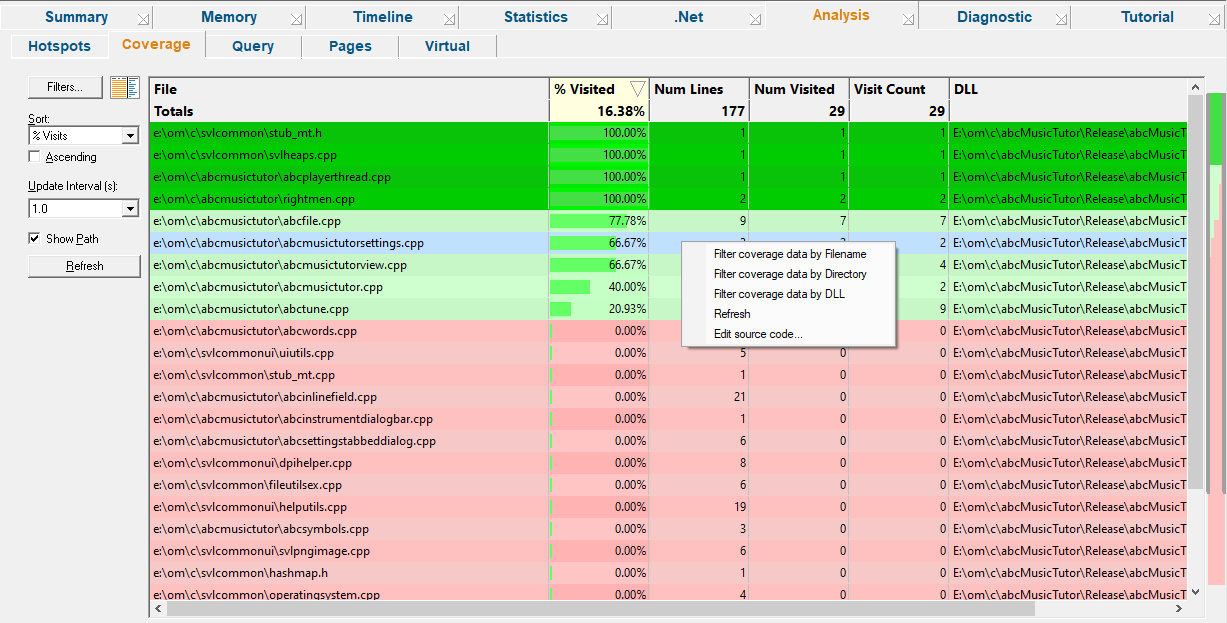
The display shows two resizable panes, one with the coverage data, and the other shows source code when you click on a row in the table.
 In order to gather coverage statistics, you'll need to switch on the memory coverage setting.
Colours used in the displays
Each file's row is coloured according to whether it has:
 no lines visited
 some lines visited
 all lines visited
 been filtered out for subsequent sessions (see below)
The % Visited column and the source code view uses:
for the percentage of lines visited, or visited lines of source code
for unvisited lines
Coverage data
The data in each column is summarised below
•File •Num Lines •Num Visited •Visit Count •% Visited •DLL |
the statistics are gathered for each source code file found number of lines in each file that allocate, reallocate or free memory and handles the number of those lines that have been visited total number of visits to those lines the percentage of relevant lines visited (Num Visited / Num Lines) the DLL responsible for the file |
The Visit Count may be equal to the Num Visited if you have opted to keep the default memory coverage setting of counting visits to each allocation only once. You can change this setting on the fly to start counting multiple visits right away.
At the top of the table is a Totals line showing combined results for all files.
The statistics here only cover lines that affect memory allocation, unlike SoftwareVerify's sister tool C++ Memory Validator which determines complete code coverage.
Sorting columns
Sorted columns are highlighted yellow in the header. Just click on the header to change the sorting column or it's sort direction order.
 See also the sorting option below.
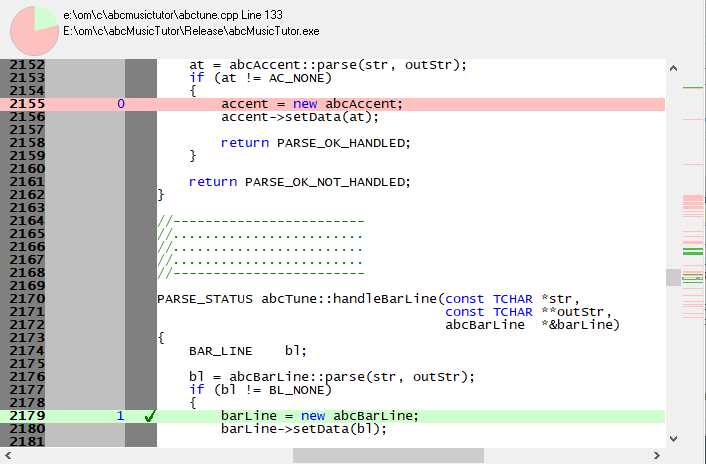
Source code view
The source code view is syntax-highlighted with green visited and blue unvisited lines.
The columns at the left show line numbers and visit counts for each allocation line which are also available via a tooltip.
Coverage options
The following controls are displayed to the left of the coverage results
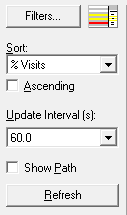
Filters
Unwanted results in the coverage can be excluded via the filters according to filename, directory or DLL.
Filters can be managed in the filters dialog or added via the menu options  below.
•Filters...  shows the coverage filters dialog
The filters dialog is the same one as found on the memory coverage page of the global settings dialog where it is described in detail.
Window orientation
The data and source code panes can be arranged horizontally or vertically with the orientation button.


Sorting
Using the drop down list to select any of the column heading items and using the ascending check box is exactly the same as sorting using the column header.
Updating the display
•Update Interval (s) automatically updates the display at your choice of interval between 0.1 and 60 seconds - or not at all!
Adjust this depending on the complexity of your application.
•Refresh updates the display - as does the  button on the Tools menu and toolbar, and the button on the popup menu
With an update interval set to No Update, you'll need to use this Refresh button to update the display when you wish.
Display settings
On the coverage tab, there's only the one display option:
•Show Path shows the short file name or the longer file path in the File column of the data
Coverage view popup menu
The following popup menu is available over the data area to add filters, refresh the view or edit source code.
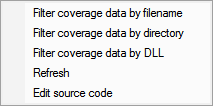
Menu options: Filtering coverage
The first three menu options let you add filters at different levels of granularity.
Filters become effective at the start of the next session. Adding a filter during a session will show the row in grey so that you can see which files are filtered, but the coverage results will continue to be included for the rest of the session.
•Filter coverage data by filename adds a new filter to the Filters dialog, excluding the selected file from the results of a subsequent session
•Filter coverage data by directory excludes all files in the same directory as the selected file
•Filter coverage data by DLL excludes all files belonging to the same DLL as the selected file
Menu option: editing source code
•Edit Source Code... opens the default or preferred editor to edit the source code