Finding the signal in the noise
When you have a lot of data, it can be difficult to see the data that really matters - the signal within the noise.
This is especially the case when looking for a specific leak, rather than looking for all leaks.
There are a number of ways to reduce the amount of data:
•reduce the data collected
•reduce the data that is displayed
•filtering the data that is displayed
•use watermarks to display data between two points
Reducing collected data
Collected data can be controlled at different levels of granularity via the settings dialog.
Some settings pages can be used for fine tuning of how the data is collected and which hooks are enabled.
The collect tab allows quite coarse control over which types of hook are installed in the target program.
 Settings menu
  Edit Settings... Data Collection Collect page
Reducing displayed data
Data that ends up being collected can be removed from the display.
Most of the main tabs have a Display button to control what's shown:
•Ages
Filtered Data
Filters operate by matching source file and line number, callstack and datatype to keep or remove data.
A combination of permanent and temporary filters can be used, as well as global, session and local filters.
Watermarks
Watermarks let you not only add markers where certain events happened, but also let you display only the data for allocation events that happened between those watermarks.
The example usage of watermarks demonstrates this at the end
Example of reducing data in the display
Here's a simple example of reducing displayed data via the display settings dialog:

launch nativeExample.exe wait until attaching is complete

File menu Exit
wait for data transfer to complete
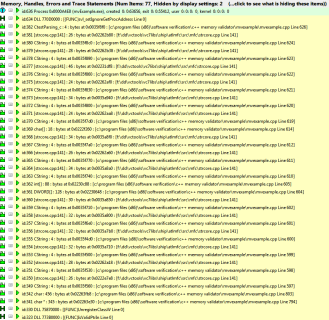
•Memory tab Refresh shows the usual leaks and also memory errors
Roughly half the data is shown here:
•Memory tab Display... select Leaks and errors in the first combo box uncheck CRT Memory OK
•Memory tab Refresh shows a much reduced set of data
All the data displayed is shown here - a much reduced set of information!
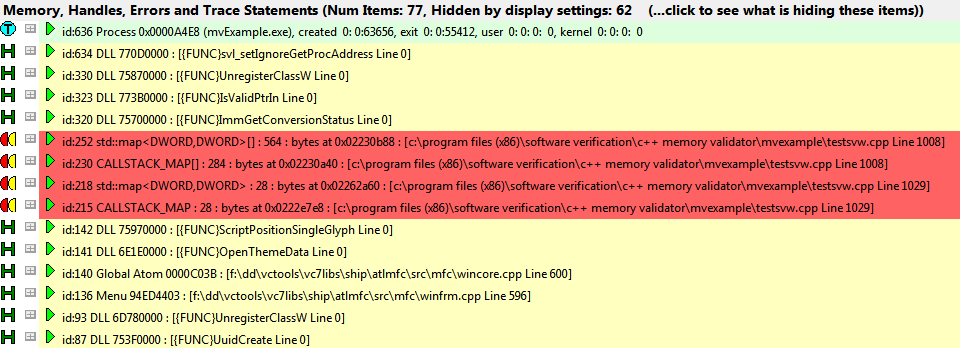
 Note the header helpfully shows the number of items hidden by the display settings, 62 compared with 2 before

The same approach could be done with other data, for example if you have allocations on other heaps:
•Memory tab Display... uncheck Heap Memory uncheck Global Alloc Memory uncheck Local Alloc Memory OK Refresh
Or to remove handle allocations from the display:
•Memory tab Display... uncheck Handles OK Refresh
When you enable or disable the Memory Errors check box in the Memory tag display settings dialog, you may also need to make a change to the first combo box to make the display change. This is because memory error traces are not considered memory leaks.