The Generations tab summarises all the allocations in the target program by their generation, as opposed to by type.
 Click a part of the image below to jump straight to the help for that area.
The view lists of all the object types in the program in generation order, with the ability to view a range of related statistics.
 The features here are roughly a subset of those on the Types tab. If you're going through this help and already read the about the Types tab, you could skip this topic and go on to the Timeline tab if you wish.
Generation tabs

Each tab provides a different group of generation statistics:
•Num Objects  How many objects of this type in this generation
•Min Objects Minimum number of objects of this type in this generation
•Max Objects Maximum number of objects of this type in this generation
•Allocated Number of objects of this type allocated in this generation
•Collected Number of objects of this type collected in this generation
If you only see 0 values this may indicate leaking objects. For example:

•Delta Difference between number of objects of this type allocated and collected
If you only see positive deltas this may indicate leaking objects. For example:

•Object Churn Object churn for this object type for this generation
Percentage of objects collected in the generation divided by the number of objects allocated in the generation. This number can exceed 100%.
High object churn - objects are being rapidly created and garbage collected
Low object churn - objects are rarely being created and rarely garbage collected. Low churn may indicate leaking objects.
•Max Churn Maximum churn for this object type for this generation
Percentage of objects collected in the generation divided by the maximum number of objects in the generation.
•Finalized How many objects of this type have been finalized.
For many objects this will always be zero.
The above values need to assessed together to determine if a particular object type may be leaking. A collected count of zero, on it's own is meaningless. But if combined with a history of allocations and only positive deltas, that's a pretty strong hint that this object type may be leaking and that you need to examine it further.
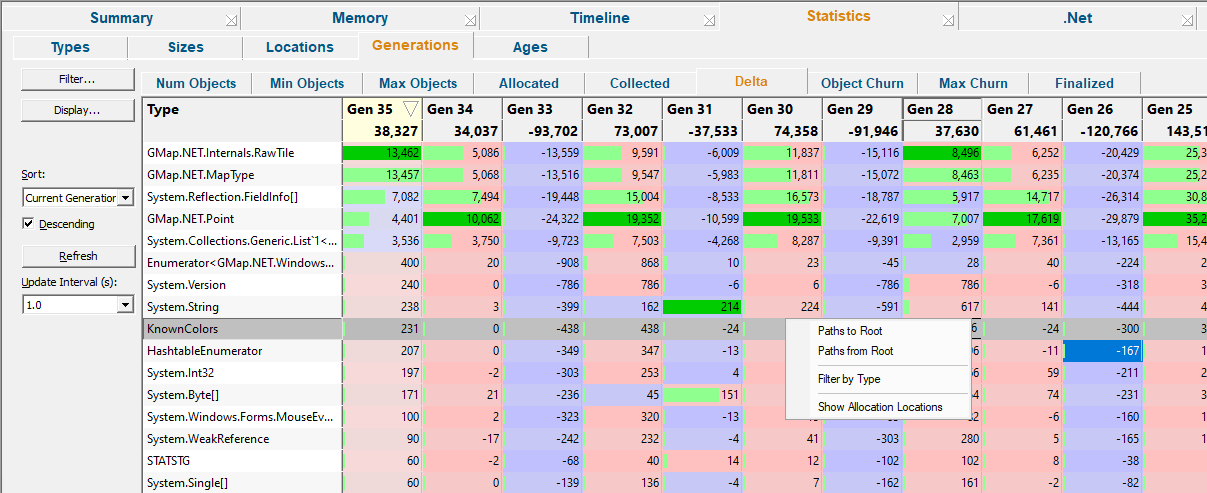
The generations data columns
The first column is the object type.
All other columns represent each generation of data. The ordering of the generation columns is controlled by the Display Settings.
The header columns display a total for the column underneath the column name.
The value in each column is determined by which tab of data is being displayed.
Colours used in the display
Each row is coloured according to whether the object has:
 an increasing count for the number of live objects of the size
 a decreasing count
 a static count
 a zero count - i.e. where all allocated objects of the size have been freed
The importance of each value within the column is highlighted with a percentage bar:
 the object size with the maximum value in a given column (not shown for all columns)
 relative contribution of the value in each column
 See also the Data Highlighting settings dialog to customise the first two colours.
The following options are available:
Sorting columns
Sorted columns are highlighted yellow. Just click on the column header to change the sorting column or it's sort direction order.
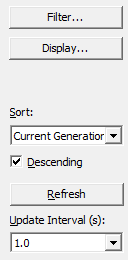
As well as the column headers we also provide explicit sorting controls to provide an extra option that isn't available from the column headers ("Current generation").
•Sort choose the generation to sort
•Descending choose the sort direction
Updating the display
•Update Interval (s) automatically updates the display at your choice of interval between 0.1 and 60 seconds - or never!
•Refresh updates the display - as does the  button on the Tools menu and toolbar
With an update interval set to Never, you'll need to use this Refresh button to update the display.
•Display... display the Generation Settings dialog.
Filter settings
•Filter... shows the Generations Filters settings dialog to edit the filters.
Generations view popup menu
The following popup menu provides options for filtering and examining data in more detail.
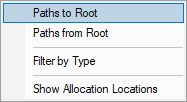
Menu option: Paths to Root, Paths from Root
The following options are only active for .Net object types. They are disabled for native object types.
•Paths to Root For all live objects of this type display all the paths from the object to the most recent heap dump roots.
•Paths from Root For all live objects of this type display all the paths most recent heap dump roots to the live objects.
Menu option: Filter by Function
The following options allow you to remove data from the display using filters.
•Filter by Type creates a filter with the selected object type.
By default filters prevent data from being displayed. You can change this using the Generation Filters.
Filters can be edited using the Filter... button to display the Generation Filters.
Menu option: Showing locations - drilling down into the data
The following option opens the Analysis Tab, adding a callstack for every allocation or deallocation of the selected object size.
This enables a deeper inspection of where and how objects of this size are allocated or freed.
•Show Allocation Generations shows allocations only
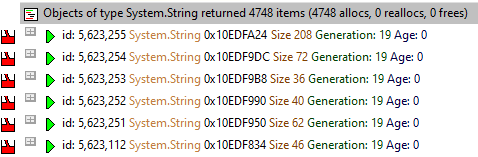
For example, showing allocations for the following row in the Generations tab will show the callstacks for 4748 allocations of System.String in the Analysis tab below: