The summary tab provides a high level overview of all memory and handle activity in the program.
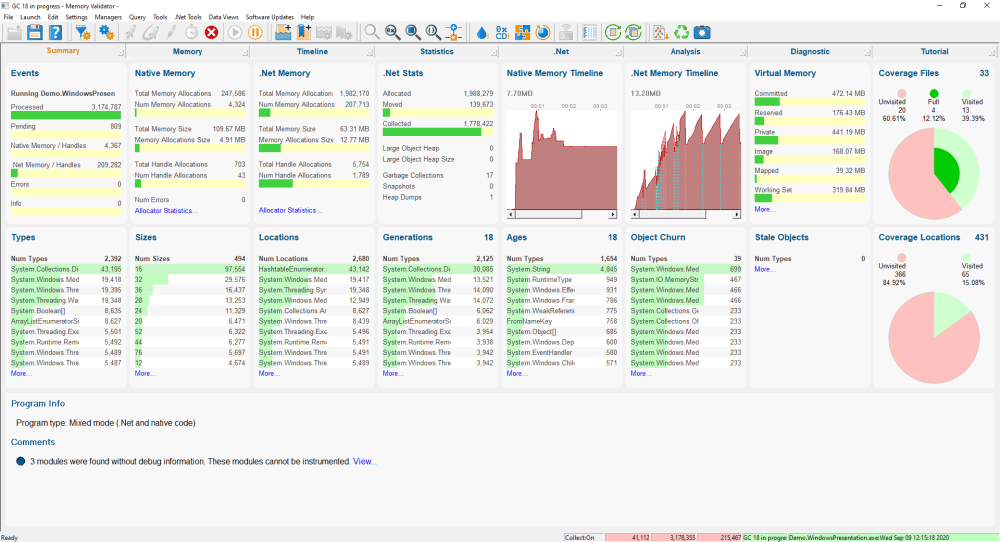
The display is divided into many panels that contain bar graphs, dials or graphs. Some of the panels also contain hyperlinks.
Clicking any bar graph, graph or dial will take you to a more detailed version of the same data.
Hyperlinks usually open a new data display or take you to a more detailed version of the same data.
Bar graphs are usually shown in green/yellow, except when there are error conditions for that statistic, when they are shown in red.
The values shown in each tile are the live counts for the data source linked to the tile. Click the More... link below the tile to go to that data source.
Events
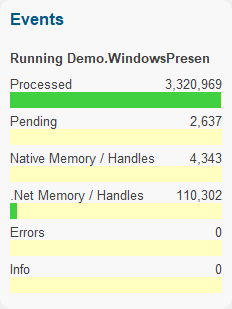
The Events panel gives you an overview of the profiling status, incoming data stream and a high level summary of any errors.
Additional information is in the status bar.
Native Memory
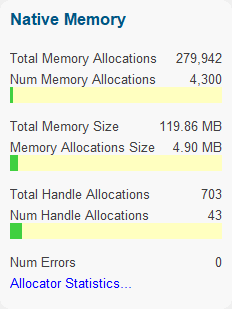
The Native Memory panel gives you an overview of all native memory allocations and native handle allocations.
More detailed information is available on the Memory tab.
The Allocator Statistics hyperlink will display the Running Totals dialog
.Net Memory
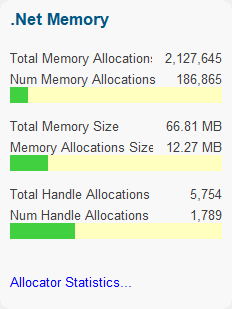
The .Net Memory panel gives you an overview of all .Net memory allocations and .Net handle allocations.
More detailed information is available on the Memory tab.
The Allocator Statistics hyperlink will display the Running Totals dialog
.Net Stats
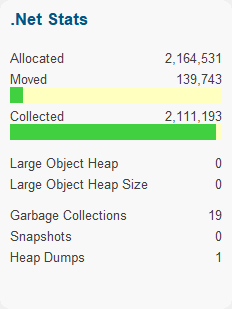
The .Net Stats panel gives you an overview of .Net allocations, garbage collections, snapshots and heap dumps.
Native Memory Timeline
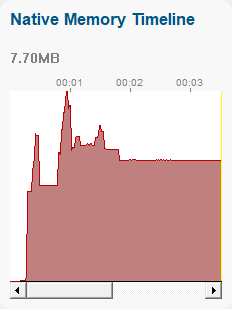
A graphical representation of native memory allocation behaviour. A more detailed version is available on the Timeline tab.
.Net Memory Timeline
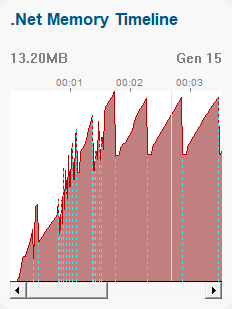
A graphical representation of .Net memory allocation behaviour. A more detailed version is available on the Timeline tab.
Virtual Memory
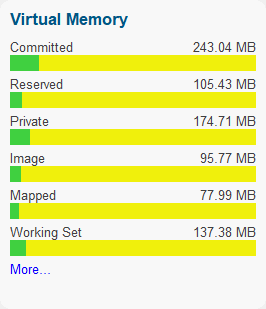
An overview of virtual memory statistics. A more detailed version is available on the Virtual tab.
Coverage Files
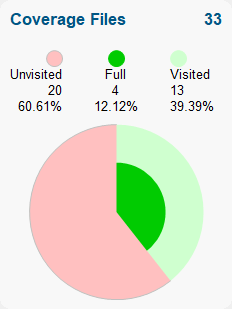
An overview of coverage of memory allocation locations by filename. A more detailed version is available on the Coverage tab.
The Coverage Files tile will only be shown if there is memory coverage data to display (Memory Coverage needs to be enabled).
Types
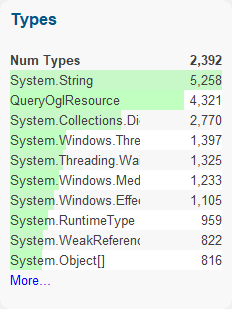
An overview of all the memory allocation types used by the target program. A more detailed version is available on the Types tab.
Sizes
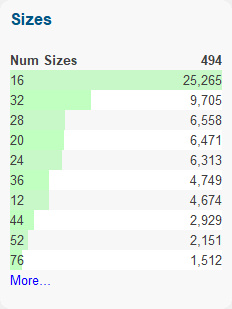
An overview of all the memory allocation sizes used by the target program. A more detailed version is available on the Sizes tab.
Locations
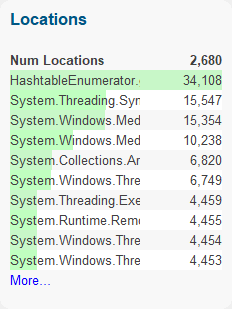
An overview of all the memory allocation locations used by the target program. A more detailed version is available on the Locations tab.
Generations
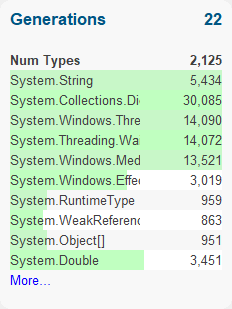
An overview of the generations for the types used by the target program for the most recent .Net generation. A more detailed version is available on the Generations tab.
Ages
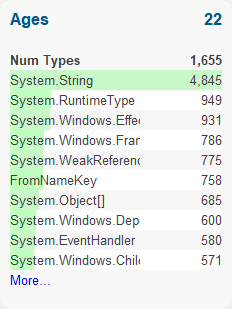
An overview of the ages of the types used by the target program for the oldest aged .Net objects in the target program. A more detailed version is available on the Ages tab.
Objects Churn
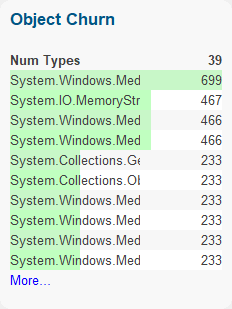
An overview of the object churn for the types used by the target program. These may indicate leaking objects.
A more detailed version is available on the Object Churn sub-tab of the Ages tab.
Stale Objects
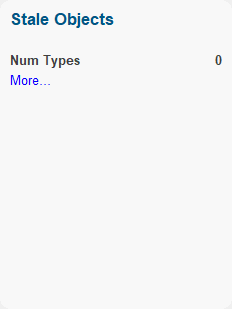
An overview of the stale object types used by the target program. These may indicate leaking objects.
A more detailed version is available on the Stale Objects sub-tab of the Ages tab.
Coverage Locations
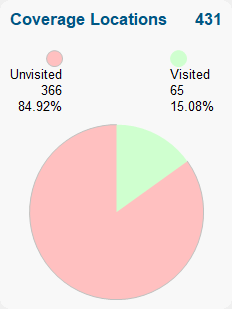
An overview of coverage of memory allocation locations. A more detailed version is available on the Coverage tab.
The Coverage Locations tile will only be shown if there is memory coverage data to display (Memory Coverage needs to be enabled).
Instrumentation Status
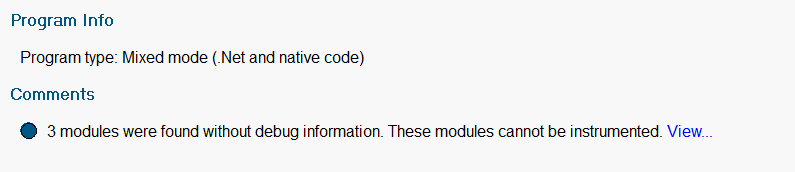
An overview of profiling settings and status information that will aid your understanding of the current profiling results.