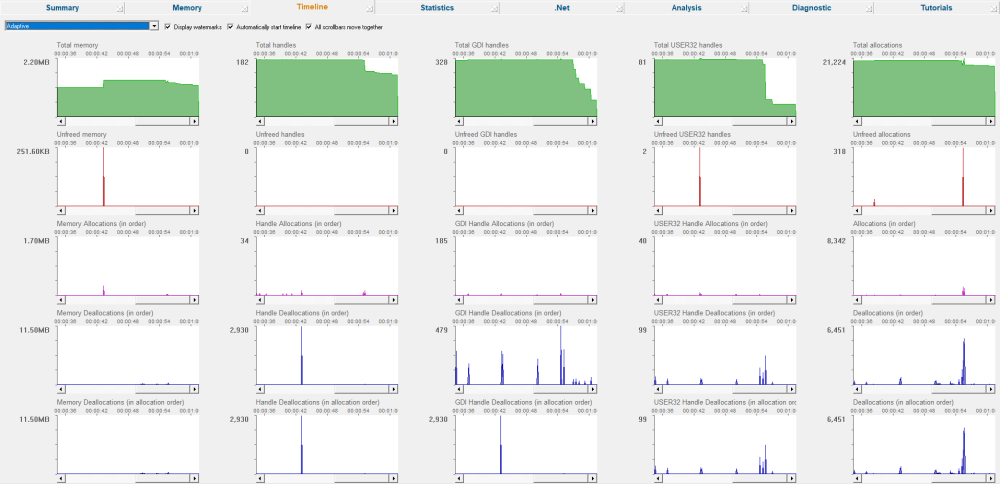
The Timeline tab gives you a set of graphical timelines showing all memory, objects and gdi handles, user32 handles and other handles tracked by Memory Validator.
 Click a part of the image below to jump straight to the help for that area.
Timeline display styles
At the top of the Timeline tab is a combo box containing a list of many display styles, allowing you to choose what data to watch.
•Adaptive  chooses a display style determined by the type of data collected from the target application. The resulting displays will be equivalent to All Native T/C, All .Net T/C and All Native and .Net T/C.
•Native Memory presents total native memory as well as unfreed memory, allocations and deallocations
•Native Handles shows similar data for native handles
•Native GDI Handles shows similar data for native GDI handles
•Native USER32 Handles shows similar data for native USER32 handles
•Native OpenGL Handles shows similar data for native OpenGL handles
•Native Objects tracks the number of native allocations and deallocations
•.Net Memory presents total .Net memory as well as unfreed memory, allocations and garbage collected memory
•.Net Handles shows similar data for .Net handles
•.Net Objects tracks the number of .Net allocations and garbage collected memory
•Native and .Net Memory presents total native and .net memory as well as unfreed memory, allocations and deallocations
•Native and .Net Handles shows similar data for native and .net handles
•Native and .Net Objects tracks the number of native and .net allocations and deallocations
•Native Allocations T/C Shows all native allocation data with topics horizontally and categories vertically
•Native Allocations C/T Shows all native allocation data with topics vertically and categories horizontally
•Native Allocations T/C Shows all .Net allocation data with topics horizontally and categories vertically
•Native Allocations C/T Shows all .Net allocation data with topics vertically and categories horizontally
•Native Allocations and Deallocations T/C Shows all native allocation and deallocation data allocation with topics horizontally and categories vertically
•Native Allocations and Deallocations C/T Shows all native allocation and deallocation data allocation with topics vertically and categories horizontally
•Native Allocations and Deallocations T/C Shows all .Net allocation and deallocation data allocation with topics horizontally and categories vertically
•Native Allocations and Deallocations C/T Shows all .Net allocation and deallocation data allocation with topics vertically and categories horizontally
•All Native T/C Shows all Native data with topics vertically and categories horizontally
•All Native T/C Shows all Native data with topics horizontally and categories vertically
•All .Net T/C Shows all Native data with topics vertically and categories horizontally
•All .Net T/C Shows all Native data with topics horizontally and categories vertically
•All Native and .Net T/C Shows all Native data with topics vertically and categories horizontally
•All Native and .Net T/C Shows all Native data with topics horizontally and categories vertically
The difference between T/C and C/T displays is that the data shown in rows is shown in columns and vice versa. Depending on the data you're interested in you may find having the data on the same row is more beneficial, or having the data in the same column in different rows is more beneficial. We provide with you both options so that you have more freedom interpreting the data.
 Why T/C and C/T? We wanted two letters that didn't look similar. We started out with X/Y and Y/X but after a while realised they are too similar.
C and T are impossible to mis-read and have the benefit of mapping to topics and categories which is helpful when thinking about the graphs rather than an abstract notion like X and Y.
Sampling periods - the key to understanding the graphs
Before covering the features, it's important to understand what these graphs are showing.
Once a second, Memory Validator takes a snapshot of the activity in the target program and plots another line on the graph to indicate how that activity affected resources.
The top graph shows snapshots of total consumption at each sample, while the others show change during each sample period.
In any given second, memory may be allocated, but not freed - although it may be freed later. This shows as a spike on the graph because there was an overall change during the sample period.
Memory allocated and freed within the same sample period does not contribute to a spike since there's no overall change.
The maximum value on any graph is the maximum change resulting from activity during any single sample period
Timeline graphs
Each memory or handle group consists of five graphs:
•Total displays the total consumption, either as an amount of memory, number of handles, or number of allocations
•Unfreed the amount of allocated data, not freed in the sample period.
To calculate this add up all the allocations in the time period, and add up all the deallocations in the time period. Now subtract the deallocations from the allocations. If the result is negative, it is limited at 0.
•Allocations (in order) shows allocation change during the sample
•Deallocations (in order) shows deallocation changes during the sample period
•Deallocations (in allocation order) timeline for deallocations in the order the related allocation happened
Each of these graphs is available for memory, handles and objects (count of all activities) for both native and .Net. Five data sources for six different counts. That makes for total of up to 30 different graphs that can be displayed depending on the choice you make with the combo at the top of the display. Which graphs you choose to use will depend on the problem you're looking at and what you find interesting.
The T/C and C/T variations of the graph allow you to examine things from different points of view. Do you want to see deallocations lined up below allocations (so that you can easily see deallocation vs allocation behaviour), or is it more interesting to see native memory and .Net memory lined up underneath each other so that you can see if the allocations in native memory correspond to the allocations in the .Net memory space?
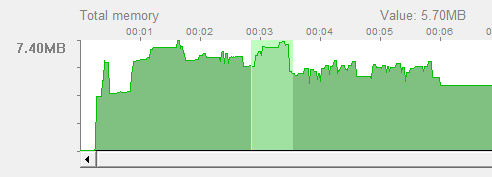
Moving the mouse over a graph shows a yellow dotted marker indicating the current sample period, and some information above the graph.
•Value displays memory usage at the sample point, or the number of allocations or handles depending on the graph
•Sequence IDs the lowest and highest event sequence ids used in that sample period
 Why is the maximum for deallocations sometimes different to the maximum for allocation Multiple related allocations and deallocations may interleave with each other. Because of the one second sampling they may also span multiple sample periods. This means that the total amount of freed memory in one period may not match that for total allocated in another period.
Why two deallocation graphs?
Comparing the two graphs and the allocation graph lets you see if deallocations are generally happening near (and in the same order) as the allocations or if they are happening some time after the allocation
You may also be able to see if the allocations are being deallocated in a different order to their allocation.
This can be useful for analysing memory usage behaviour and performance.
Timeline view popup menu
The following popup menu is available over the top three timelines to examine data in more detail, and is identical to the one over the Sizes tab.
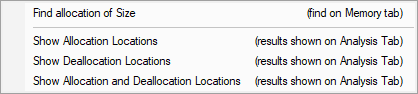
Menu option: Showing locations - drilling down into the data
The following three options all open the Analysis Tab, adding a callstack for every allocation or deallocation in the selected sample period(s).
This enables a deeper inspection of where and how objects of this size are allocated or freed.
•Show Allocation Locations shows allocations only
•Show Deallocation Locations shows deallocations only
•Show Allocation and Deallocation Locations shows both
The range of data to which the menu applies is as follows:
•If you have selected a range of sample periods, all the events in that range will be shown
•If no range is highlighted, we will only show the events in the single sample period at the exact point you click the mouse
Timeline controls
There are just three check boxes to control the display of data.

•Display watermarks shows all watermarks on the graphs as a dashed vertical blue line
•Automatically start timeline starts the timeline at the point the application is launched
•All scrollbars move together synchronises the use of scrollbars on each timeline so they all move together - just uncheck this for independent control
If you manually scroll the timeline to look at some data and then wish the timeline to scroll as new data is added, scroll the timeline to the extreme right. It will automatically start scrolling as new data is added.
 You can control how long the timeline can show data for (and hence the memory used for the timeline) in the