The Virtual tab shows a graphical or tabulated view of all the memory in the target program, and how it's being used.
If the Virtual tab isn't visible, use the Data Views menu to set which views are shown.
 Click a part of the image below to jump straight to the help for that area.
The virtual tabs
At the top of the display are three tabbed data views: one graphical, and two tabulated:

•Graphic  a graphical visualisation of virtual memory pages, similar to that used on the main Pages tab
•Pages a tabulated view of each 4K virtual memory page used by the target application
•Paragraphs a tabulated view of each virtual memory paragraph
Each of the three views includes data from Win32 Heaps, CRT heaps, DLLs, Memory mapped files and thread stacks.
 Note that the view supports an address range of 2GB, or 3GB on suitable operating systems if the target application has been built with the /3GB
 and /LARGEADDRESAWARE parameters.
Memory usage types
The virtual tab views show the memory type as being one of the following. Default colours are shown here, but can be changed.
 Commit Commited memory, allocated with VirtualAlloc()
 Reserve Reserved memory, allocated with VirtualAlloc()
 Free Free memory, whether unused or deallocated
 DLL used by EXEs, DLLs and assemblies in the program
 Stack stack space used by threads
 Mapped memory mapped files
 Heap allocated by HeapAlloc() etc
 CRT allocated by the C runtime: malloc, calloc, new etc
 Stub workspace memory used by Memory Validator in the target process
 out of address range
Normally, the virtual memory manager treats memory only as free, committed, or reserved, since it doesn't care that a given region of memory is stack space, DLL storage space, a memory heap etc. Memory Validator adds the additional memory types to make the results more useful.
Graphic view
The graphic view uses a single pixel, coloured as above, to visualise the state of each 4K page of memory, wrapping from left to right and top to bottom.
If there is no target program being monitored, or the program has closed, the display will appear black.
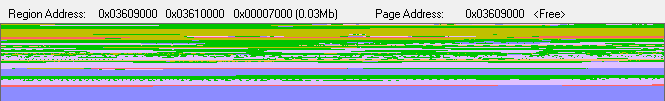
Hovering the mouse over the display shows information at the top of the view about the region and page under the pointer.
•Region Address: shows the start and end address of the contiguous coloured region of memory, and its size (hex and decimal)
•Page Address: shows the page address
•<Memory usage information> shows the memory type (as above) at the end of the line and optional extra information
For a heap, its handle value is also displayed.
If the region is a process module (DLL, EXE, etc), then its filename is shown.
If you're testing this display using the supplied example program, you might want to allocate quite a large block of memory, eg 10Mb or more, to make it significant in the display.
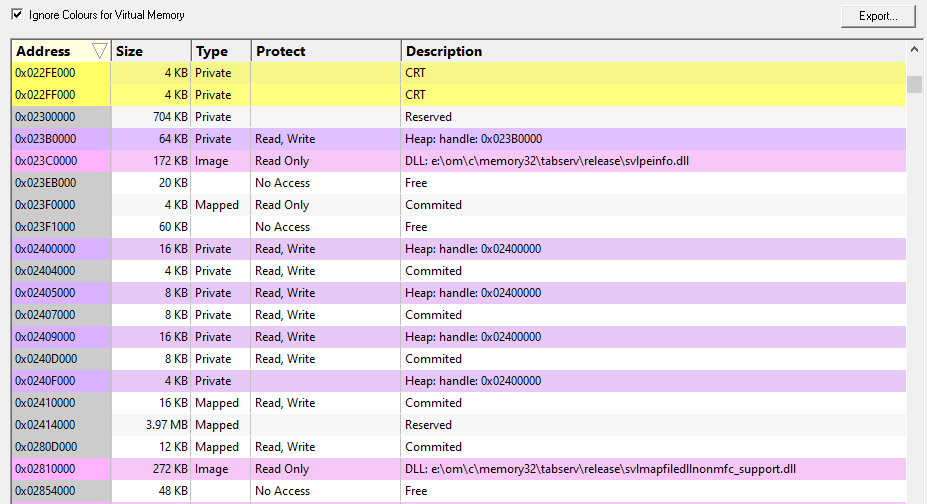
Pages view
The Pages view lists similar data as the graphic view, showing the allocation state of each page and region of memory in the program.
For each area, the address, size, type, protected state and description of the area are given.
Unlike the graphical view, if the target program has exited, this view keeps the last known state
A few options are available above the list:
•Sort chooses which column to sort by, the default being to sort by ascending address
This is exactly equivalent to clicking in the header row of columns in the table itself.
•Descending swaps the ascending or descending ordering of the hotspots
•Ignore Colours for Virtual Memory toggles whether to highlight the areas of memory in the list that are marked as commited, reserved or free
•Export enables the export of virtual memory data in HTML, XML or CSV file formats
 Read more about exporting virtual memory data and the format of the exported data.
Paragraphs view
The Paragraph view displays very similar data to the previous Pages view, but using larger chunks of memory.
A paragraph is defined by dwAllocationGranularity in the SYSTEM_INFO data structure returned from GetSystemInfo, but is typically 64K.
Virtual tab options
At the far left of the window are the usual options for updating the refresh interval and setting display colours.
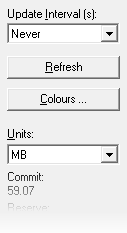
Updating the display
•Update Interval (s) automatically updates the display at your choice of interval between 0.1 and 60 seconds, or the default of Never!
Choose an interval suitable for the size of your application, as lots of data may take longer to draw than the interval itself !
•Refresh updates the display - as does the  button on the Tools menu and toolbar
With an update interval set to Never, you'll need to use this Refresh button to update the display.
Display settings - colours
•Colours shows the Virtual Memory Colours dialog to change the colours used in the views for each type of memory usage above
Each colour can be changed via the  button, or all colours can be reset to their defaults.
Apply updates the colours in the virtual view without closing the dialog.
Memory usage totals
Below the options are the total accumulated amounts for each type of memory usage above.
•Units sets the units for displaying the total values in MB, KB or the number of pages
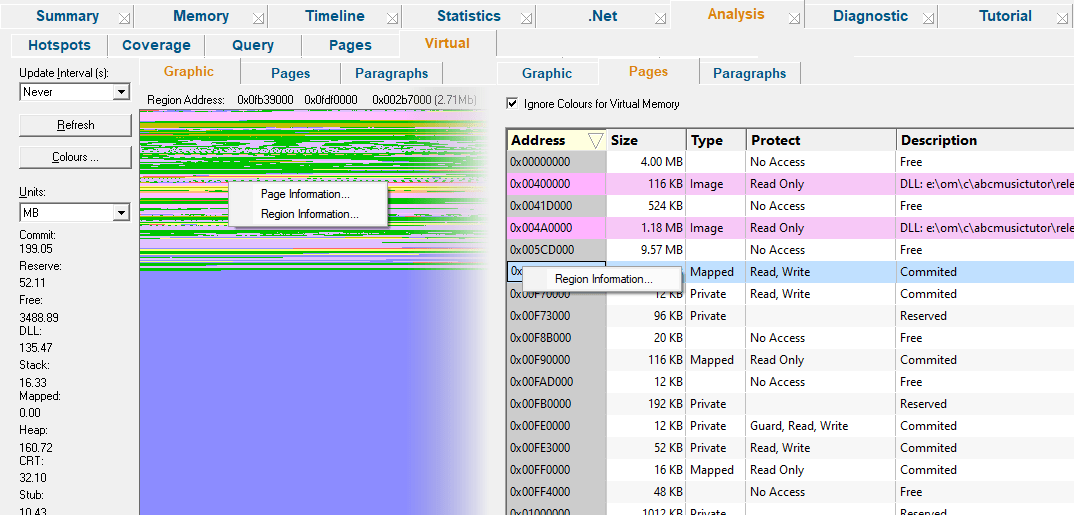
Virtual view popup menu
Each virtual view has a popup menu giving access to allocations, reallocations and deallocations in a page or region:
All views give region information and view data, but only the graphical view also gives page information for the point under the cursor.
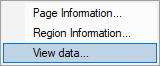
•Page information... allocations in the selected page (pixel)
•Region information... allocations in the same selected contiguous region of memory with the same type.
No dialog? Not all pages and regions contain allocations, in which case, no allocation dialog appears, and you'll hear a beep (if you have speakers on!). If your allocations are generally on the CRT heap for example, look for the corresponding coloured areas - the CRT memory usage is yellow by default.
An example of the page information dialog is below. The region information shows the first and last page address accordingly.
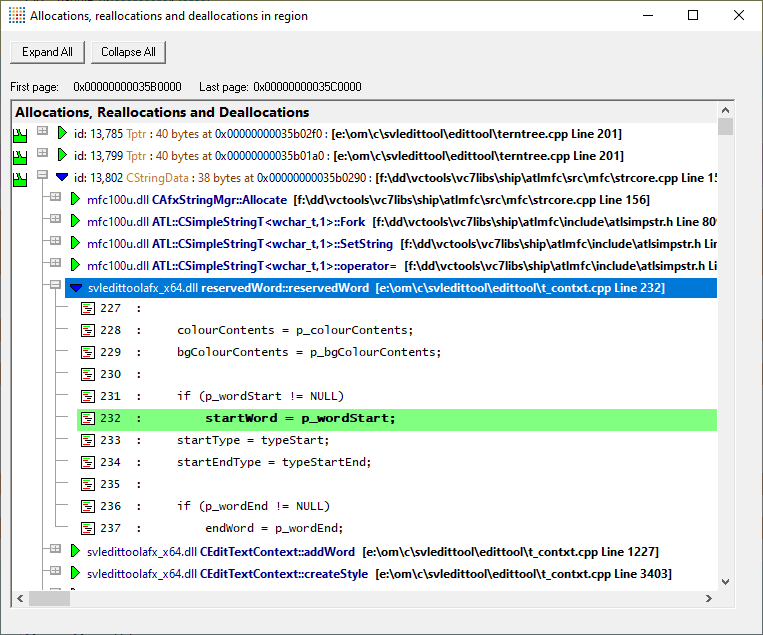
The allocations in the dialog can be expanded, to show the local source code, and double clicking launches your preferred editor with the source file.
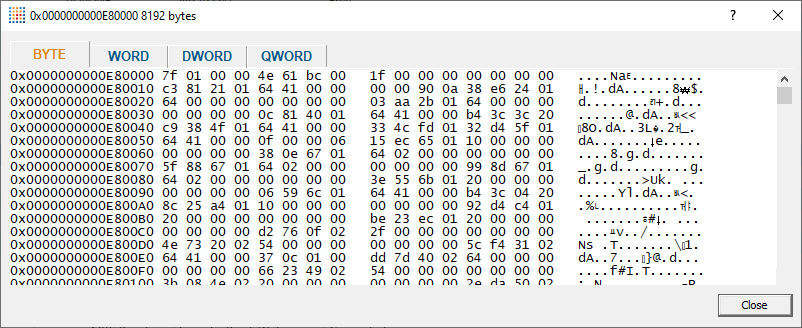
•View data... shows the bytes for selected memory region, if that region is readable. CAUTION, this option can be very slow.