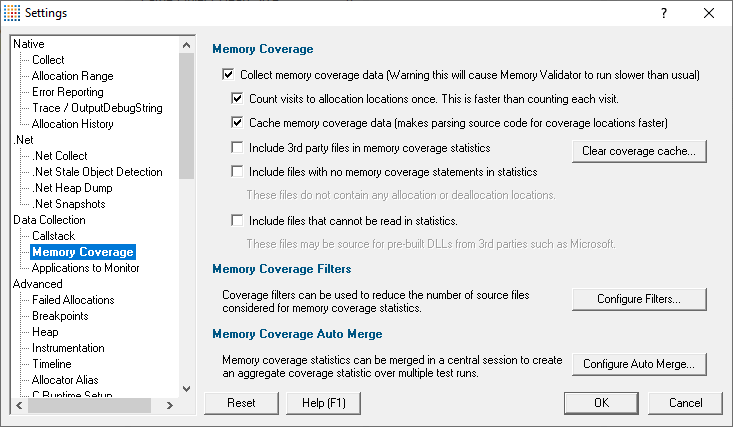
The Memory Coverage tab allows you to control how Memory Validator gathers coverage statistics for memory and handle allocations.
The default options are shown below:
What is memory coverage?
Calculating memory coverage involves parsing your source code to determine all allocation and deallocation locations and matching that information with information from the callstacks of each allocation in your session.
Some of these activities are time consuming, so the default is not to collect memory coverage data, but you can control the behaviour as below.
Controlling memory coverage data collection
•Collect memory coverage data  enables the collection of memory coverage data
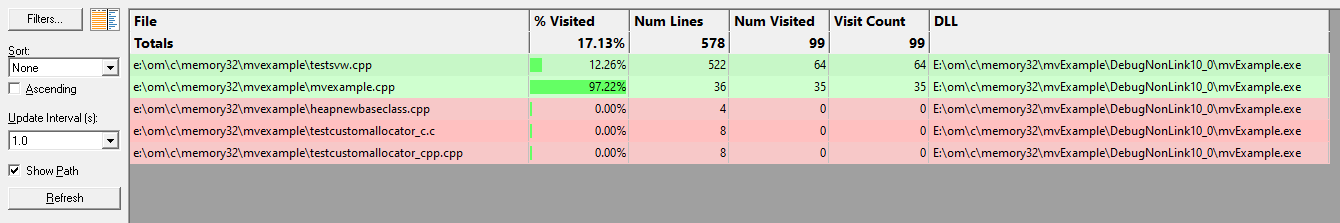
The Coverage tab (example shown below) shows the memory coverage statistics for each file that contains memory or handle allocation statements. This allows you to check how well you are testing your memory allocation/deallocation code.
When the collection of memory coverage data is enabled, the are some options to tune the performance.
•Count visits to allocation locations once only count line visits once per line when this is selected (default)
Normally each line is counted just once (faster). Although they can be counted for all visits to each line, this will be noticeably slower for large applications.
•Cache memory coverage data enable caching of coverage statement information (default)
Calculating the coverage statements for each file can be time consuming, especially for large applications as it requires parsing the source code each time the application is run to determine where the allocation and deallocation locations are.
Caching the coverage statement information improves this by only recalculating it when the source code is modified.
•Clear Coverage Cache... delete any existing memory coverage cache files stored on your computer
•Include 3rd party files in memory coverage statistics include 3rd party files as specified in File Locations
For most activities you will want to keep this option deselected
•Include files with no memory coverage statements in statistics includes relevant source code files
Some source code files do not allocate or deallocate memory or handles. As such these files may be viewed as unwanted data on the coverage report, so the default is not to include these
•Include files that cannot be read in statistics includes source code filenames referencing files that do not exist on your computer
Typically these are third party files in pre-built DLLs. By default they are not included in the statistics.
Memory coverage filters
Memory coverage calculation is quite likely to include some third party source files or header files that are out of your control, e.g. from STL, third party files in pre-built DLLs, etc.
If you don't want results to include such files, you can specify a number of filters to exclude them.
Coverage filters need to be set before the session starts in order to affect results.
•Configure Filters... shows the Memory Coverage Filters dialog that lets you manage the list of filters...
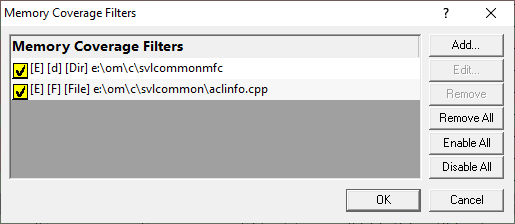
This dialog is the same one accessed via the local Filters button on the Coverage tab.
The Filters dialog has some basic controls for managing the filters:
•Add... adds a new filter, as in the example above
•Edit... or double click an item in the list opens the Memory Coverage Filter dialog to modify the enabled state, type or target of the selected filter item
You can also enable/disable an item via the yellow checkbox on each item in the list
•Remove deletes all selected filters in the list, or press Delete
•Remove All clears the list of filters
•Enable All sets all filters active
•Disable All sets all filters inactive (but does not remove them from the list)
Each filter can only be one of the three types: filename, directory or DLL. However, you can mix and match multiple filters of any type.
For example, to add a new filter:
•Configure Filters... Add... choose a filter type filename, directory or DLL Browse... (or enter a path directly) choose a relevant item to add OK OK
To help recognise types of filters in the list, each item is prefixed by some bracketed flags as follows
[E] - enabled
[X] - disabled
[F] - file
[d] - directory
[D] - DLL
[File] - file
[Dir] - directory
[DLL] - DLL
Memory coverage auto merge
Different runs of your application may execute different parts of your application, in which case you might want to merge the results of one run with the results of another.
•Configure Auto Merge... shows the Auto Merge dialog that lets you configure merging of memory coverage results
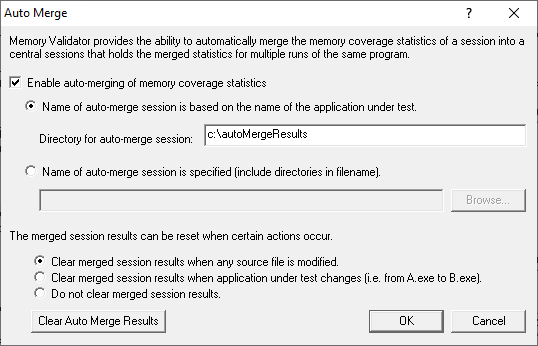
The automatic merging works by merging the results of each individual memory coverage session into a central session.
The central session is stored on disk in a file you specify, or in a file using the name of the session, e.g. TestThis.exe would get saved in TestThis.mvm in the same directory as Memory Validator resides.
•Enable auto-merging of memory coverage statistics switches the merging feature on (default is off)
Depending on how many applications you are performing memory coverage on, you may want your memory coverage data to go to one central location or to a different location for each application under test.
•Name of auto-merge session is based on the name of the application under test saves the central session in a file named according to the application under test in this session (the default)
By default, the auto-merge session will be stored in the same directory as Memory Validator, but you can change this:
Directory for auto-merge session saves the auto-merge session in the specified directory
For example, if you run the application nativeExample.exe, and specify a central session directory of e:\memoryCoverageResults, the central session will be saved in a file named e:\memoryCoverageResults\nativeExample.mvm.
•Name of central session is specified save the auto-merge session in a filename and path of your choice (enter or Browse... to a file)
Auto-merge session reset
The auto-merge results can be automatically cleared by certain triggers, or not cleared at all.
When performing memory coverage analysis sometimes you will uncover a bug in your software and need to modify the software, and/or run different executables. When this happens, line numbers and/or files often change, and you usually wouldn't want to merge memory coverage data from the modified software with existing coverage data.
The triggers for clearing the merged session results are:
•When any source file is modified (the default)
•When the application under test changes
•No clearing of merged session results occurs under any circumstance
Reset All - Resets all global settings, not just those on the current page. Any memory coverage filters added as above are also removed.
Reset - Resets the settings on the current page. Any memory coverage filters added as above are also removed.