The Line Times tab displays statistics about each line of code visited in the application under test.
 Read on, or click a part of the image below to jump straight to the help for that area.
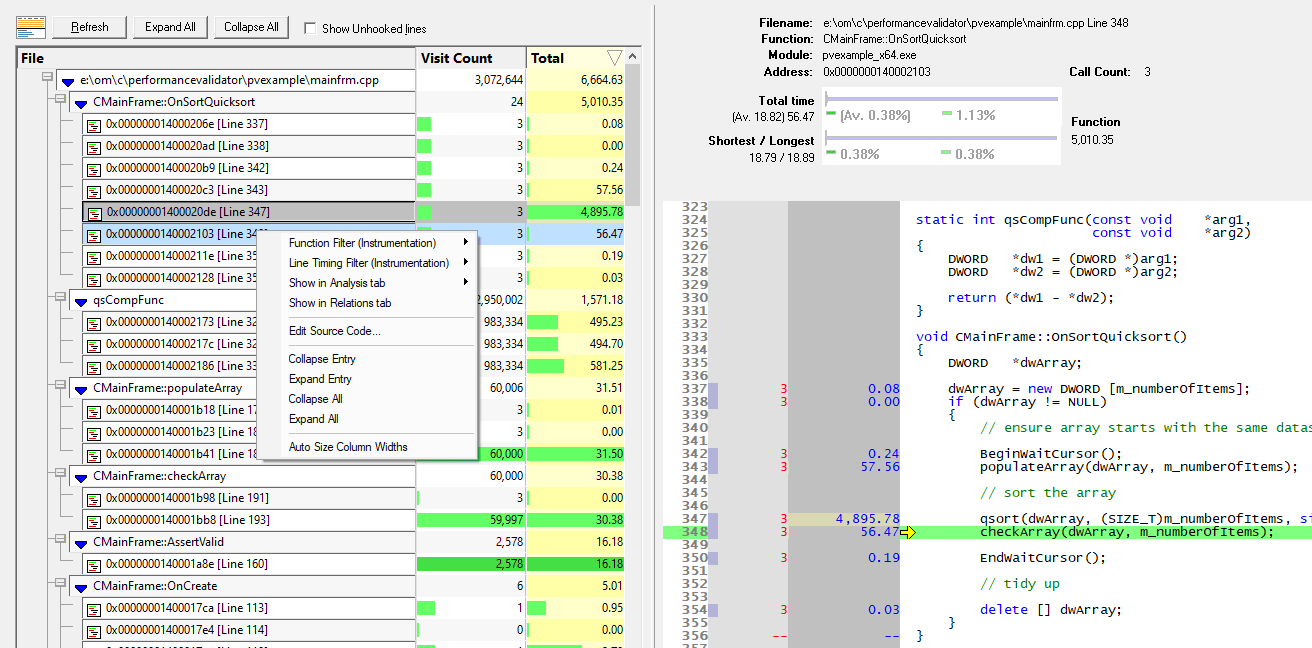
As with many of the tab views, the display is split into two resizable panes.
•The table of files and lines on the left has performance data for each line
The table's popup menu provides plenty of options to filter data or to examine more detail
•The right side shows the source code view for any file, function or line selected on the left
Line timing in sampling mode
Line timing is not possible when using the sampling method of data collection.
The option to collect line time information will be disabled in the Launch dialog, and at the top of the Lime Times view, you'll see the following message:

The line times view
Performance data is shown for every visited line in the functions and files that have been hooked.
The lines are ordered hierarchically in a tree organised by file, function and line.
The data can be sorted via the headers of any column, although there are fewer columns than for the Statistics or Relations tab:
•Visit Count  the number of visits to a line
A function shows accumulated visits for all lines in the function.
A file shows accumulated visits for all lines in all functions in the file.
•Total the time a line and any associated child functions take to execute
Functions show total function time.
Files show accumulated time for all functions in the file.
•Average average time a line takes to execute, including associated child functions
Functions and files show no useful information and are left blank or zeroed.
•Shortest the shortest time a function and its child functions take to execute
•Longest the longest time a function and its child functions take to execute
Double clicking any item will display the function on the Relations tab.
Lines which could not be hooked will be coloured brown in the table and marked by hyphens in the source code.
 Note that while your application is executing, the sorted data is live. Sorting may not complete correctly as the data may change during the sort. Only when your program has finished executing is the sorted data guaranteed accurate.
Line timing calculation method
Timing calculations for each line are made using the processor's time stamp counter unless the OS supports the provision of per-thread CPU cycle counts (Windows Vista onwards).
 See Performance settings for Line Timing.
Window orientation
To adapt to your screen layout, the horizontal or vertical orientation of the line times and source code panes can be toggled with the orientation button.


Updating the display
•Refresh updates the display - as does the  button on the Tools menu and toolbar
As there's no auto update here, you'll need to use this Refresh button to update the display when you wish.
A refresh automatically collapses the nodes in the tree.
•Collapse / Expand All hide or show every node in the tree
•Show Unhooked lines choose whether to include the unhooked lines in the data
•Do not scroll first column optionally keep the first column fixed when scrolling the table horizontally
Managing the data being displayed
There are two ways to change what's displayed in the view.
•hide or show whole columns of data in the table
•filter out unwanted functions, or only show specific functions of interest
Finding text
To find text in the tree, use the Find Dialog where you can search the function and file names, as well as the data in the other columns.
Since the text for lines in the file column includes line numbers and addresses, it happens that you can search for that information too.
The source code view has its own Find and Goto dialogs.
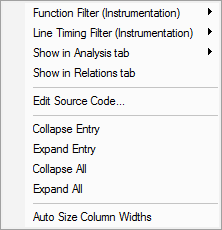
Call tree menu options
The following popup menu is available over the data to add filters, examine relations or edit code.
Menu actions apply to the function in the tree at the menu-click location.
Menu options: Function filter (Instrumentation)
While the display filter controls visibility of hooked data, instrumentation filters control which functions are hooked in the first place.
The function instrumentation filter sub-menu lets you add hook filters at different levels of granularity.
The affect of adding function filters here depends on the current filter settings:
•If the current filters are set to hook everything, adding new filters will switch to excluding newly selected hooks
•Otherwise, the current filter will be retained, i.e. hook or don't hook newly selected items
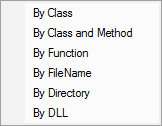
The first three options add filters to the Class and Function Filter Settings:
•By Class adds a new filter, excluding the entire class from the results of subsequent sessions
•By Class and Method excludes only the selected function from new sessions
•By Function excludes all matching function names irrespective of their containing class or even if not in a class at all
The next two, Filename and Directory, are part of the Source Files Filter settings.
•By FileName adds a new filter, excluding all functions in the same file (as the selected item) from the results of subsequent sessions
•By Directory excludes functions in all files in the same directory as the selected function
Finally, the DLL level is controlled by the Hooked DLLs settings.
•By DLL excludes functions in all files belonging to the same executable or DLL as the selected function
Instrumentation filters become effective at the start of the next session. Adding a filter during a session will show the relevant rows in grey so that you can see which files would be filtered, but the performance data will continue to be included for the rest of the current session.
Menu options: Line timing filter (Instrumentation)
Line timing instrumentation filters control which lines are hooked for line timing and are independent of the function filters above.
The affect of adding line timing filters here depends on the current line timing filter settings:
•If the current filters are set to hook everything, adding new filters will switch to only including newly selected hooks
Note that this is the opposite of function filters.
•Otherwise, the current filter will be retained, i.e. hook or don't hook newly selected items
The line timing instrumentation filter sub-menu lets you add hook filters at three different levels of granularity.
Each option add filters to the Line Timing Filter Settings:
•By Class adds a new filter, appending the entire class in the line timing results of subsequent sessions
•By Class and Method include only the selected function in the line timing of new sessions
•By Function includes all matching function names irrespective of their containing class or even if not in a class at all
Instrumentation filters become effective at the start of the next session. Adding a filter during a session will show the relevant rows in grey so that you can see which files would be filtered, but the performance data will continue to be included for the rest of the current session.
Menu option: Show in Analysis tab
The Analysis tab shows results of a query on the call tree based on the selected function and the criteria chosen from the menu:
•Show in Analysis tab choosing any item in the following sub-menu, to be switched to the Analysis tab
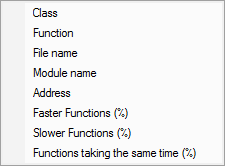
For example:
•Class the Analysis tab will show all points in the call tree that match the class of the selected function
•File name shows all points in the call tree that match the file name of the selected function
•Slower Functions (%) shows all functions that are slower than the selected function
Menu options: Show in Relations tabs
•Show in Relations tab switch to the Relations tab where you can examine functions that either call, or are called by, the selected function
Double clicking any item will also display it in the Relations tab.
Menu option: editing source code
•Edit Source Code... opens the default or preferred editor to edit the source code
Menu options: Expand and collapse
The last few menu options expand and collapse parts of the tree.
•Collapse / Expand Entry close or recursively open the selected function to its full extent
•Collapse / Expand All completely collapse or expand the entire tree
Menu option: column widths
•Auto size column widths sets the width of each column in the table appropriate to the content within
The file source code view
Clicking on any function or line in the tree shows that function's source code file in the right hand pane.
The source code view is described in detail separately as its behaviour is the same for all views, although the function information bars differ slightly to other displays.