The Relations tab displays information about the slowest or most called functions in your program, as well as their calling functions or functions that are called by them.
 Read on, or click a part of the image below to jump straight to the help for that area.
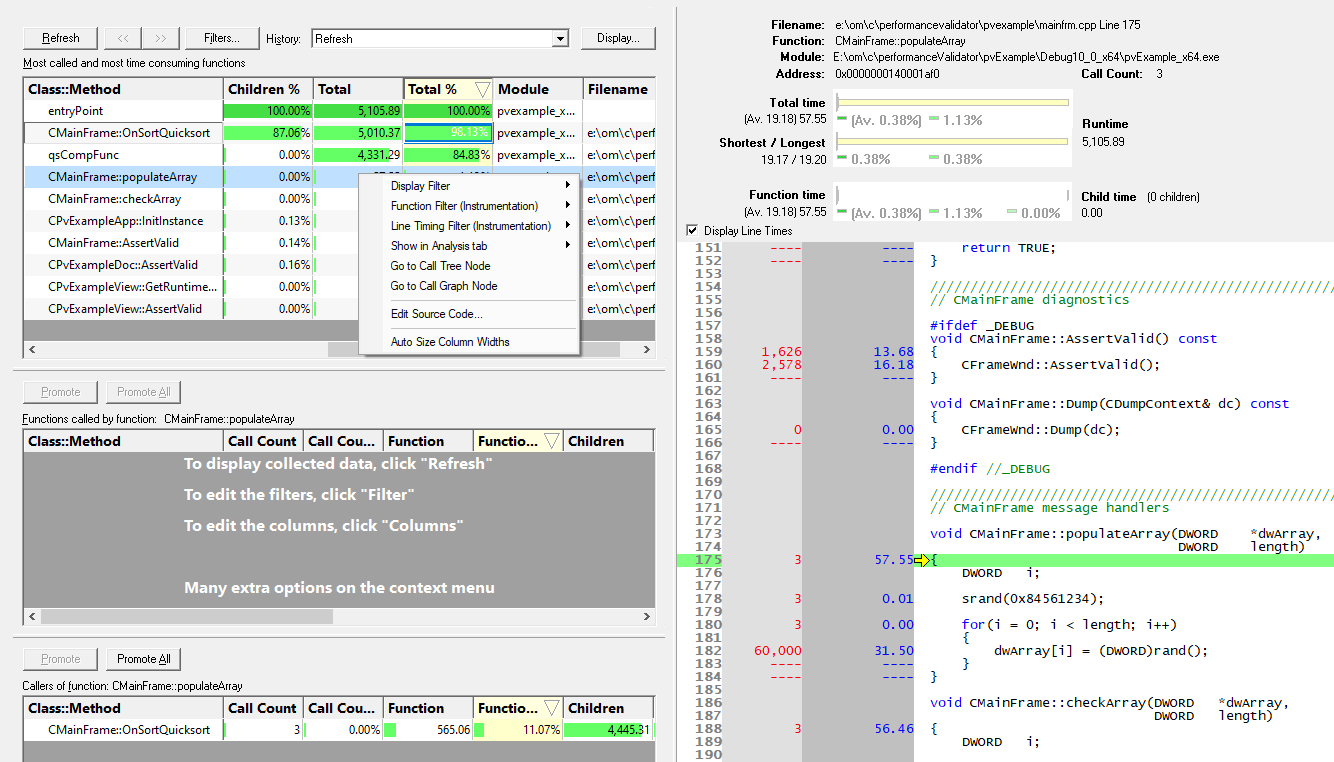
As with many of the tab views, the display is split into two resizable panes.
•the left side shows three tables of related functions:
•most called and most time consuming functions
•functions called by one of those functions
•functions that call one of those function
Each table's popup menu provides options to filter data or to examine it in more detail
•The right side shows the source code view for any function selected from any table on the left
Most common and most time consuming functions
The table shows a list of functions, with the statistics displayed being identical to that shown in the Statistics view.
This top table can be populated with functions in several ways:
•use Refresh to update the list with the top items, using display options
 There is no automatic refresh - the display is only updated on a manual refresh.
•select a function from another tab view to make it appear here
For example, double clicking any function in the Statistics view will display the selected function here.
•promote one or more functions from one of the two lower tables
The statistics can be sorted by any column and filtered by class, function, file or module.
The amount of information displayed can be controlled by adding or removing columns or by filtering for specific areas of interest.
When a function is selected in this table, the lower two tables update to show information about called and caller functions.
Percentage bars
Like the Statistics tab, all cells in the tables that show numerical data have a percentage bar indicating one of the following:
•the function's value relative to the maximum value in the column
•the function's percentage contribution to the total
Updating the display
•Refresh  updates the display with the top functions - as does the
  button on the Tools menu and toolbar
As there's no auto update, you'll need to use this Refresh button to update the display when you wish.
When manually refreshing the top functions, you may be interested in a certain performance measurement:
•Display choose one of the available criteria by which to display the top functions
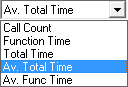
The default is Average Total Time - i.e. the average time taken by a function and all its children.
Changing the metric will refresh the list functions in the table.
When in sampling mode, Sample Count will be the only available option here - i.e. the number of times a function appears in the sampled collection data.
•Quantity set the number of items to show when refreshing the top functions
•Copy copies data from the header block above the source code to the clipboard
Managing the data being displayed
There are two ways to change what's displayed in the view.
•hide or show whole columns of data in the table
•filter out unwanted functions, or only show specific functions of interest
Changing which columns are displayed
You can sort the data in the tables by clicking in the table headers.
The choice of which columns to display is the same on the Statistics and Relations tabs. In fact, you can control columns in both areas from the same configuration dialog.
Each table on the Relations tab has control of its own columns, but by default, the displayed columns are synched across all three tables.
•Columns shows the Configure Columns dialog for the Relations view
If you're using a sampling method to collect statistics, you'll see the dialog on the right.
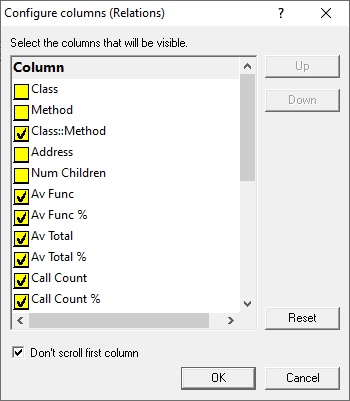
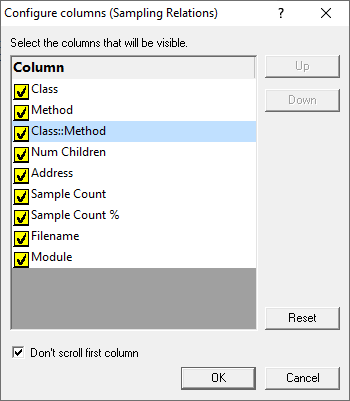
Check or uncheck which columns you want to show and hide.
•Up / Down nudge a selected column name up or down in the list
Columns at the top are displayed left-most in the table
•Reset set the visibility and the order of columns back to their defaults
•Don't scroll first column optionally keep the first column fixed when scrolling the table horizontally
Unless you changed the visible columns, or reordered them, the first column will typically be Class::Method.
All three tables are affected.
•Apply to all display tabs if checked (default), the changes you make will affect all three tables and the data on the Statistics tab
Once configured, click OK to apply the changes.
Filtering data in the tables
The display filters affect which functions are hidden and shown in the data. They do not affect which functions are hooked in the first place.
•Filters shows the Relations Display Filter Manager:
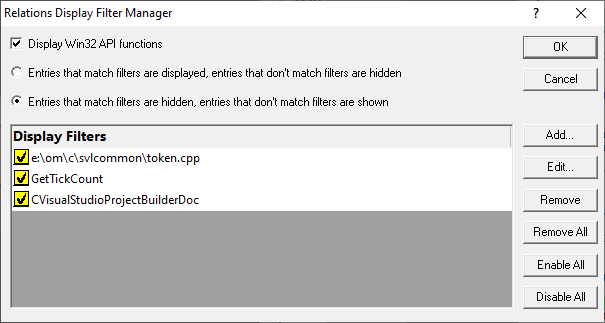
The dialog initially has no items in the list. Add some items manually or use the convenience filter options on the popup menus.
•Add... displays the display filter dialog described below
•Edit... opens the display filter dialog populated with the selected item's criteria, ready for editing
Alternatively, just double click an entry in the list to show the filter dialog.
•Remove remove selected filter(s) in the list
•Remove All remove all filters
•Enable All enables all filters in the list
•Disable All disables all filters
You can also enable or disable individual items in the list via the yellow check box at the left of each row.
•Display Win32 API functions if selected this displays Win32 API functions otherwise Win32 API functions are hidden
•Entries that match filters are displayed select this to display only matched items
•Entries that match filters are hidden select this to remove matched items from the display
Take care when selecting Entries that match filters are displayed as clearing the list and leaving this checked will leave no functions being displayed at all!
The display filter affects all three tables.
The Display Filter dialog
The dialog below allows you to create a filter based on matching one or more criteria.
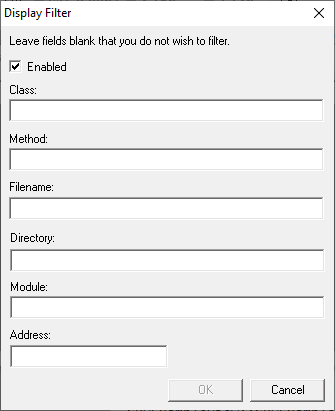
If you don't enter some of the details, they simply won't form part of the match criteria
•Enabled set this particular filter active or inactive
This is exactly equivalent to checking the listed item in the display filter manager.
•Class enter the class name that the filter must match
If you enter a class but no method name then all functions in the class are filtered.
•Method enter the method name
If you enter a method but no class then the filter will match the named function in any class.
•Filename filter all functions in the specified file
The full path to the file is required.
•Directory filter all functions in the specified directory
The full directory path is required.
•Module filter all functions in the specified module
The full path to the module is required.
•Address filter an exact address in memory
Browsing history
The History option provides a simple way to revisit previously refreshed or promoted functions:
•<< / >> navigate backwards or forwards through the groups of functions
These buttons will be disabled if there are no prior or later views available.
•History select a result directly from the drop-down menu
Where a set of functions resulted from a manual refresh, the item in the drop down list is labeled Filter Refresh.
Navigating the browsing history affects only the set of functions displayed. It does not revert display filters or other options.
If your session is still running, navigating back and forth in the results doesn't update the numbers. Only a manual Refresh does this.
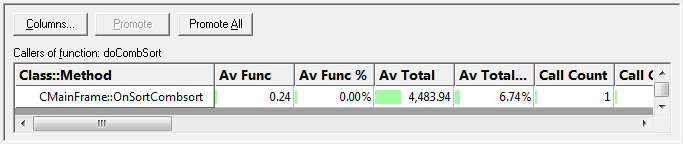
Called and caller functions
When a function is selected in the top table, the lower two tables update to show information about called and caller functions.
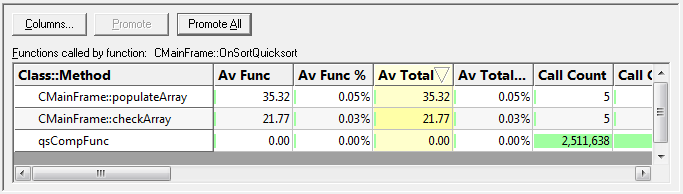
Column visibility is controlled as for the top table.
Both tables give you the option to promote one or all functions into the top table.
Repeating this process effectively navigates up or down the call tree hierarchy.
•Promote push the selected function into the top table
Double clicking an item has the same effect.
•Promote All push all the functions into the top table
Finding text
To find text in the top table, use the Find Dialog where you can search in any or all of the different columns.
 The source code view has its own Find and Goto dialogs.
Relations menu options
The following popup menu is available over the tables to add filters, examine relations or edit code.
Menu actions apply to the function for the row at the menu-click location.
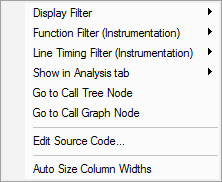
The menu options are identical in behaviour to the Statistics tab menu options so if you've already read that you can skip to the next topic - the Call Tree.
Menu options: Display Filter
The display filter sub-menu below provides a quick and convenient way to hide or show data based on attributes of the selected item.
Choosing any of these options will add the filter to the Display Filter dialog.
For example:
•Class hides all functions belonging to the same class
•FileName hides all functions that were in the same file
Filtering out functions will reduce the number of functions displayed, even if there are more 'top' functions than specified by the Quantity setting
These options work well for filtering out something you see in the display that you'd like to remove. You may not get the results you expect if the Display Filter dialog is set to have the filters inverted.
Menu options: Function filter (Instrumentation)
While the display filter controls visibility of hooked data, instrumentation filters control which functions are hooked in the first place.
The function instrumentation filter sub-menu lets you add hook filters at different levels of granularity.
The affect of adding function filters here depends on the current filter settings:
•If the current filters are set to hook everything, adding new filters will switch to excluding newly selected hooks
•Otherwise, the current filter will be retained, i.e. hook or don't hook newly selected items
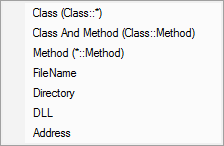
The first three options add filters to the Class and Function Filter Settings:
•By Class adds a new filter, excluding the entire class from the results of subsequent sessions
•By Class and Method excludes only the selected function from new sessions
•By Function excludes all matching function names irrespective of their containing class or even if not in a class at all
The next two, Filename and Directory, are part of the Source Files Filter settings.
•By FileName adds a new filter, excluding all functions in the same file (as the selected item) from the results of subsequent sessions
•By Directory excludes functions in all files in the same directory as the selected function
Finally, the DLL level is controlled by the Hooked DLLs settings.
•By DLL excludes functions in all files belonging to the same executable or DLL as the selected function
Instrumentation filters become effective at the start of the next session. Adding a filter during a session will show the relevant rows in grey so that you can see which files would be filtered, but the performance data will continue to be included for the rest of the current session.
Menu options: Line timing filter (Instrumentation)
Line timing instrumentation filters control which lines are hooked for line timing and are independent of the function filters above.
The affect of adding line timing filters here depends on the current line timing filter settings:
•If the current filters are set to hook everything, adding new filters will switch to only including newly selected hooks
Note that this is the opposite of function filters.
•Otherwise, the current filter will be retained, i.e. hook or don't hook newly selected items
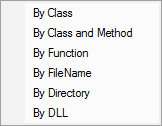
The line timing instrumentation filter sub-menu lets you add hook filters at three different levels of granularity.
Each option add filters to the Line Timing Filter Settings:
•By Class adds a new filter, appending the entire class in the line timing results of subsequent sessions
•By Class and Method include only the selected function in the line timing of new sessions
•By Function includes all matching function names irrespective of their containing class or even if not in a class at all
Instrumentation filters become effective at the start of the next session. Adding a filter during a session will show the relevant rows in grey so that you can see which files would be filtered, but the performance data will continue to be included for the rest of the current session.
Menu option: Show in Analysis tab
The Analysis tab shows results of a query on the call tree based on the selected function and the criteria chosen from the menu:
•Show in Analysis tab choose any item in the following sub-menu, to be switched to the Analysis tab
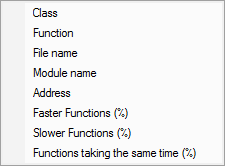
For example:
•Class the Analysis tab will show all points in the call tree that match the class of the selected function
•File name shows all points in the call tree that match the file name of the selected function
•Slower Functions (%) shows all functions that are slower than the selected function
Menu options: Show in other tabs
•Go to Call Tree Node switch to the Call Tree view where the display will be expanded to show the first match found for the selected function
•Go to Call Graph Node switch to the Call Graph view where the display will be expanded to show the first match found for the selected function
Menu option: editing source code
•Edit Source Code... opens the default or preferred editor to edit the source code
Menu option: column widths
•Auto size column widths sets the width of each column in the table appropriate to the content within
The file source code view
Clicking on a function in any of the tables shows that function's source code file in the right hand pane.
The source code view is described in detail separately as its behaviour is the same for all views.