The Diagnostic tab displays information collected by Performance Validator about the target program.
There are four sub tabs:
•Diagnostic information
•Data captured from stdout and stderr
•Environment variables
•Child processes
Diagnostic
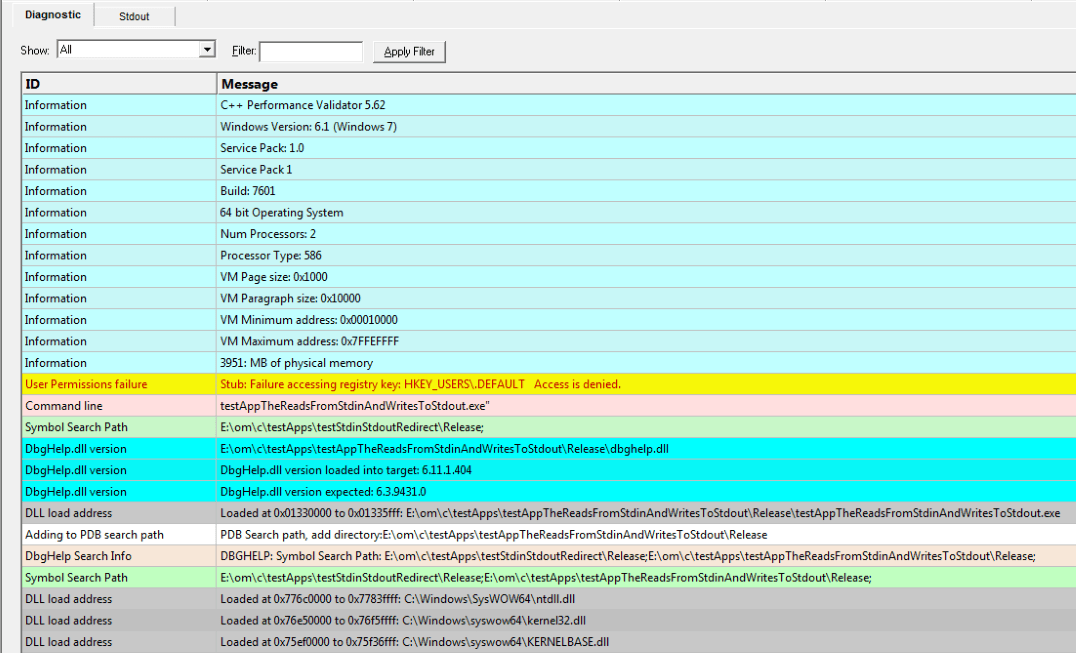
Diagnostic information
When Performance Validator's stub is injected into the target program, it logs diagnostic information to the main window for inspection.
Examples of diagnostic data collected are below, and may be displayed with a message, although you may not see some of these if all is well:
Hooking information |
Other information |
•Ordinal hook found •Function hook success or failure •Delay loaded function hooked •Possible hook found •Function already hooked •Hook at address |
•DLL load address •DbgHelp searching •Image source line •Unknown instruction found •Disassembly of troublesome code •Other text message |
The locations of loaded DLLs are also displayed in the window for each LoadLibrary(), LoadLibraryEx() and FreeLibrary() in the target program.
 If for whatever reason, you don't want to collect diagnostic information, you can switch it off in the Data Collection > Miscellaneous settings.
Unhooked lines
Messages indicating that particular source lines could not be hooked are common and are because there was not enough space to safely insert a hook for the particular line.
This is normal and is to be expected. The number of lines that cannot be hooked because of this will vary from program to program, and from debug mode to release mode based on what the program is doing and how the program is optimized.
Filtering diagnostic information
By default, all information is displayed, but you can filter the messages to show only one type:
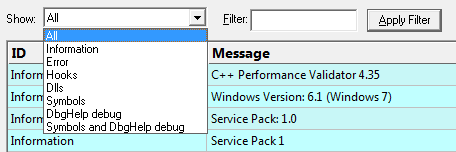
•All  the default option is to show everything
•Information operating system and environment information, etc
•Error notification of denied access and other error messages
•Hooks hooking success and failure messages
•DLLs DLL related information
•Symbols symbol loading status messages
•DbgHelp debug messages from DbgHelp.dll about the DLL symbol search processes
•Symbols and DbgHelp debug both the previous two
As well as filtering different types of lines, you can also search for specific terms:
•Filter enter some text and Apply Filter to show lines with the term in the Message column
When identifying why symbols aren't loading, you'll find it's much easier when showing only the DbgHelp debug information.
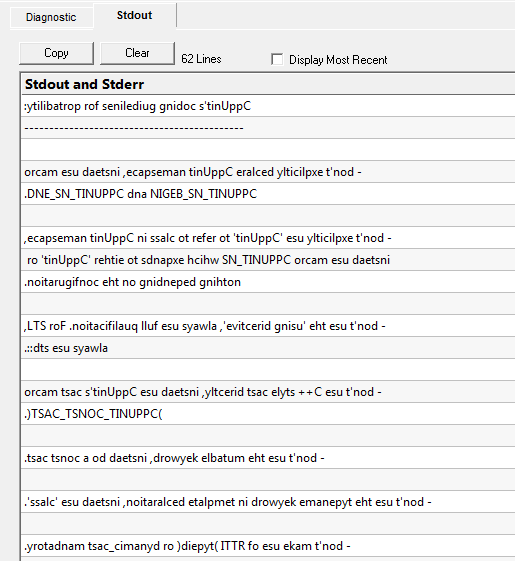
The Stdout tab displays any data collected from stdout and stderr.  The option to enable this data collection is specified on the launch dialog/wizard.
The above image shows some data collected from a program that reverses the characters in each line passed to it.
•Copy copy all data from the display on to the clipboard. For large amounts of data this can be time consuming.
•Clear clear the display of any captured data.
•Display Most Recent the display will be scrolled to ensure the most recently captured data is displayed.
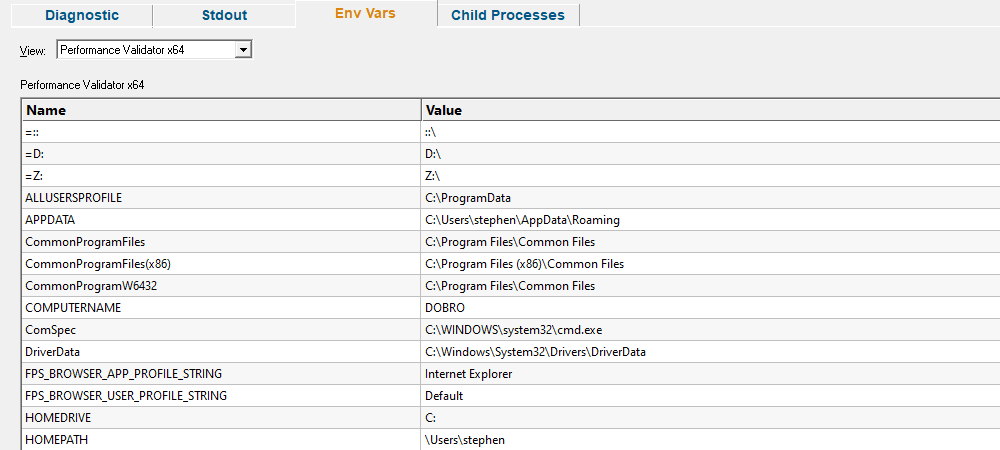
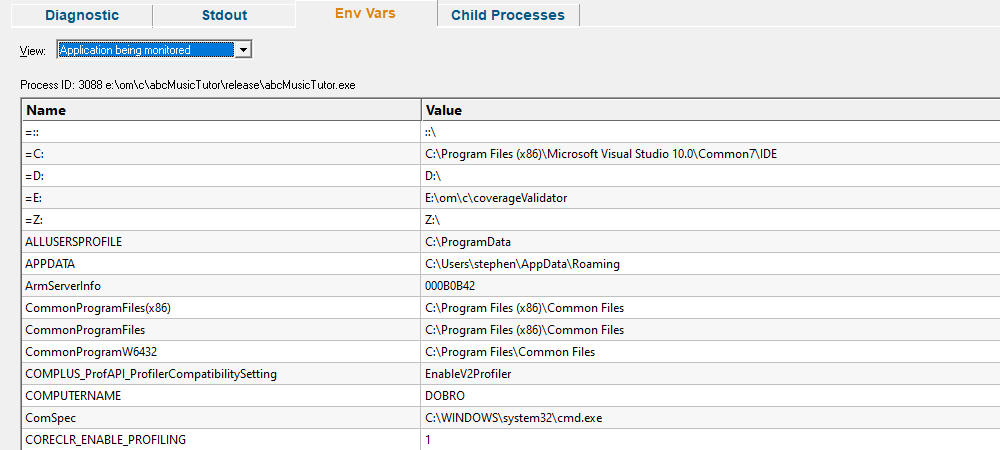
Environment Variables
Environment variables tab displays environment variables from Performance Validator, environment variables from the program under test and environment variable substitution errors.
Choose which data you wish to view using the combo box at the top left of the tab.
Performance Validator environment variables
Target application environment variables
If you launched the target application from Performance Validator the target application’s environment variables will be similar to those in Performance Validator, but with some additional env vars to control .Net profilers and and some other SVL_ prefixed env vars to communicate various data to Software Verify components that are loaded.
If you launched the target application as a standalone application, or service and used one of our APIs to connect to Performance Validator, the environment variables shown will reflect those in force at the time the application/service was started, and the account that application/service is running on.
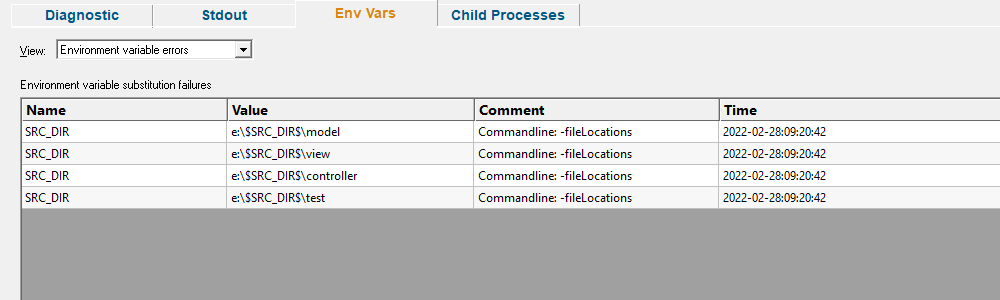
Environment variable errors
The environment variable errors display shows the name of the environment variable that could not be found, the string containing the environment variable, a comment indicating where the string came from (in this example, the command line), and a timestamp.
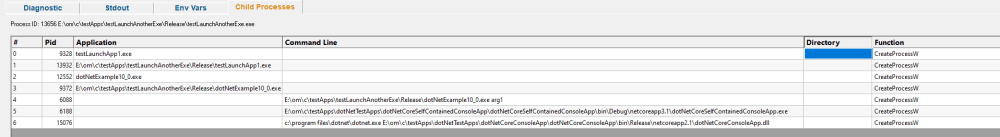
Child Processes
Information about child processes, and the appropriate launch parameters passed to CreateProcess (and related functions) are displayed on this tab.
A context menu is provided to allow you to perform some actions with the launched application data.
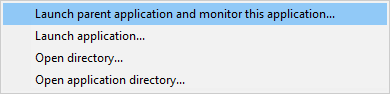
•Launch parent application and monitor this application... the launch application dialog is displayed configured to launch the parent application and monitor this application
•Launch application... the launch application dialog is displayed configured to launch and monitor this application
•Open directory... Windows Explorer is launched to view the contents of the launch directory (the directory field is empty nothing will be shown)
•Open application directory... Windows Explorer is launched to view the directory that contains the application (if the application specification has no path nothing will be shown)