All the performance data tabs have a source code view on the right hand side, each with identical behaviour, although the Line Times tab has slightly different data on the bars.
The file source code view
Clicking on a function in a table or tree shows that function's source code file in the right hand pane.
The source code uses syntax highlighting, with the background colour of the line marking the line of interest.
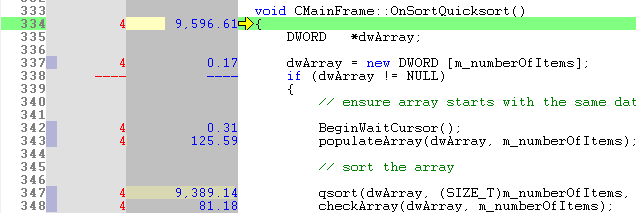
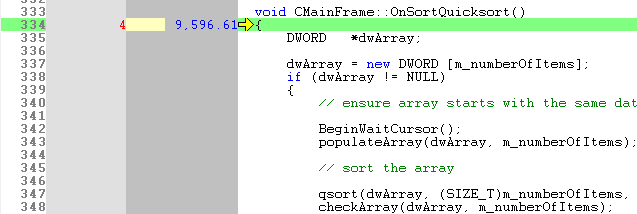
Call counts and timings are shown in-line with the code.
Source code line times
If the collection of line times has been enabled, an extra checkbox is shown above the source code.
•Display Line Times  if checked, shows the embedded visit count and line time information for each line of code
The very first line of a function will always show function visit counts and function times.
Lines which could not be hooked will be identified with ----.
Examples with and without individual line times:
Source code function information
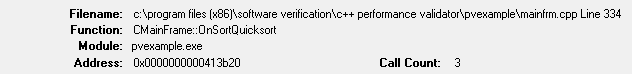
On the right hand panel, above the source code, you'll find some information about the source file.
At the top is a text summary of the function, including:
•the function and its address
•the filename and executable or DLL
•the number of times the function was called
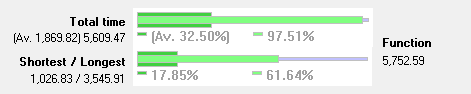
Function information bars
Below the textual summary, you'll also see three horizontal bars which provide a visual signature for the function's impact on performance.
These bars show many of the same performance timing and percentage statistics as seen in the left hand panel.
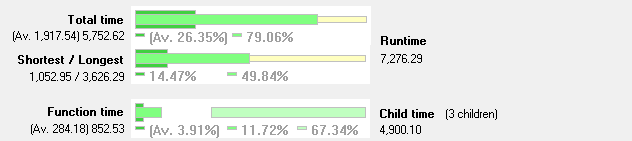
From top to bottom, each bar shows a deeper view of the function's behaviour:
The top bar shows total function times (including children):
 Average total function time relative to runtime
 Total function time relative to runtime
The second bar shows the range of times for individual function calls, including children:
Shortest function time relative to runtime
Longest function time relative to runtime
The last bar shows the segmentation of time in function and in child functions:
Average time in function relative to runtime
Total time in function relative to runtime
 Total time in child functions relative to runtime
 Time in function and time in children sum to the total function time. The gap between these in the third bar therefore indicates time in all other functions.
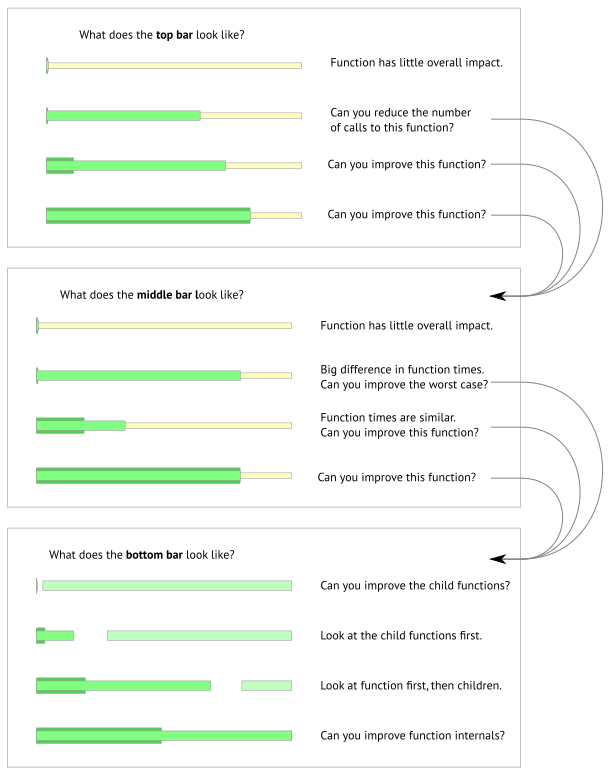
Reading the bars
The extent of the colours in the bars helps to provide a hint as to the impact the function has on performance and where it might be improved.
The following guide can be used to interpret the bars to see where improvements might be made:
Line time information bars
On the Line Times tab, the information in the bars is different. They show selected line time relative to function time, rather than to runtime.
The top bar shows total line times:
Average total line time relative to total function time
Total line time relative to total function time
The bottom bar shows the range of times for individual line calls:
Shortest individual line time relative to total function time
Longest individual line time relative to total function time
The longer the green bar, the more this line of code contributes to the function time, and therefore identifies a line within the function that most needs improvement.
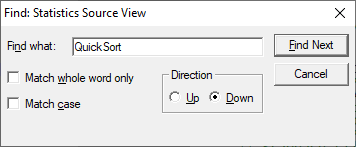
Find and Goto
When the source code view has focus, some keyboard access is available to search for text, or to navigate to numbered lines.
In the source code view,  +
+  lets you search by full or partial match anywhere in the file.
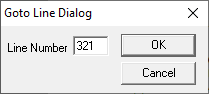
Also in the source code view, +  displays a goto-line dialog.
 To find text in the data tables, call tree or call graph, use the Find Dialog where you can search many different criteria.