The Call Graph view displays the performance data as a hierarchical tree, similar to the Call Tree.
 Read on, or click a part of the image below to jump straight to the help for that area.
As with many of the tab views, the display is split into two resizable panes.
•the left side shows an ordered hierarchical view of the functions called in the program's execution
The graph's popup menu provides options to filter data or to examine it in more detail
•The right side shows the source code view for any function selected on the left
The call graph view
Performance data is shown in an ordered graph for every function that has been hooked and called.
Functions are initially ordered by Total Time - the time a function and its child functions contribute to the total run time.
Child functions that get called will appear as child nodes in the graph; just expand a node to dig deeper.
Selecting a function shows its source code on the right hand pane.
Double clicking any item will display the function on the Relations tab.
Functions in the graph may display one of the following icons:
 Function is not the main instance but links to its main node in the graph via the menu options
 Function call is recursive
 Note that while your application is executing, the data is live and may not show correctly, for example some percentages may be large. Only when your program has finished executing is the data guaranteed accurate.
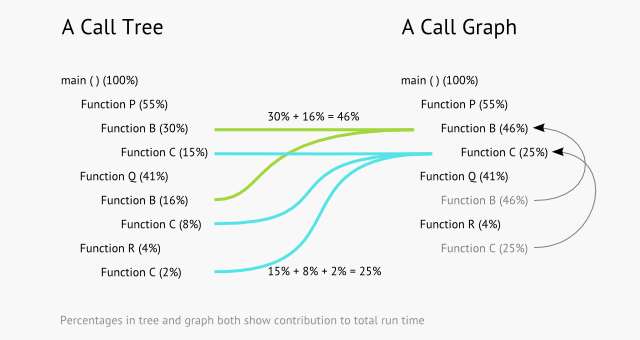
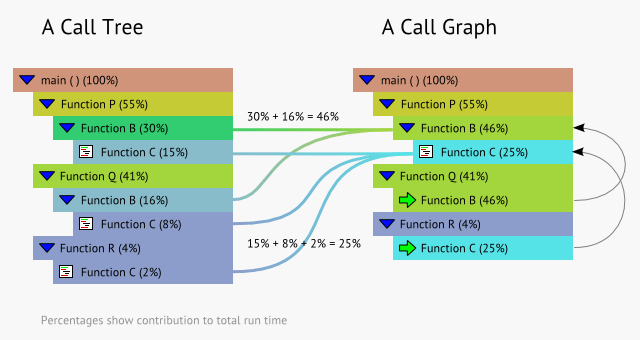
The call graph vs the call tree
In a call tree the same hierarchy of functions and their children can appear in multiple locations if called by different parent functions.
In a call graph that hierarchy can only appear once. There will be one main instance and multiple links to it from other locations in the graph.
The main instance will detail timings as a combined total for everywhere that a function is used.
This is as opposed to a call tree where function timings are for the time spent only in the callstack that leads to the node.
This is demonstrated in the following example where...
•Functions P and Q both call B which in turn calls C
•Function R calls C directly
The call tree on the left below shows different timings for each of the 2 calls to B, and the 3 calls to C. These are the contributions from the different callstacks.
In the call graph all the times are summed together.
The call graph shows one main instance for B and C, and although there are other entries for functions B and C, all those do is link to the main instance.
In Performance Validator these examples might appear as below, with the tree and graph both coloured according to Total %.
Window orientation
To adapt to your screen layout, the horizontal or vertical orientation of the call graph and source code panes can be toggled with the orientation button.


Updating the display
•Refresh  updates the display with the called functions and performance data - as does the
  button on the Tools menu and toolbar
A refresh automatically expands the first nodes in the graph and highlights the most time consuming low-level function.
As there's no auto update here, you'll need to use this Refresh button to update the display when you wish.
•Collapse / Expand All hide or show every node in the graph
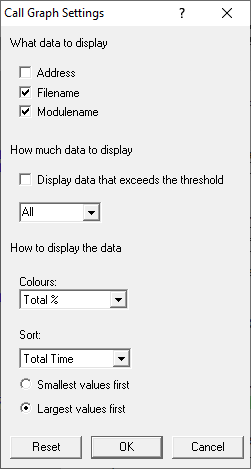
•Display... shows the Call Graph Display Settings dialog
•Copy copies data from the header block above the source code to the clipboard
Call graph colours
The graph is coloured using the customisable Hotspot Colours settings that range from 100% down to 0%.

•Colours choose the way the colour scheme is applied in the graph
•Total % colouring is based on function time relative to the total execution time
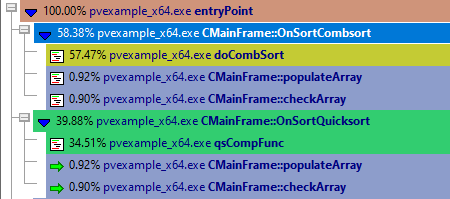
qsCompFunc is in the 30-40% colour band as it contributed 34.51% to the total run time
doCombSort is in the 50-60% colour band as it contributed 57.47% to the total run time
•Total % Scaled similar to Total % but relative to the total time attributed to the function's top level node in the graph
This colour scheme 'stretches' its range to use the full range of colours under each top level node.
Multi-threaded programs may have multiple roots, and the sampling data collection mode may also result in multiple roots, since sample callstacks won't always join up.
Colours cannot be compared between different top level nodes as they may each be responsible for very different contributions to the program's total run time.
If there is only one top level node, the two colour schemes will be identical.
•No Colour black and white display only
Sorting the data
The graph is initially ordered by most time consuming function first (Total Time)
•Sort choose one of the criteria from the list Refresh the display
The options are:
•Total Time the time all calls to a function and its child functions contribute to the total run time
•Average Time the time an average call to a function and its child functions contribute to the total run time
•Call Count the number of times a function appears in the sampled collection data
When in sampling mode, Call Count will be the only available option here
•Ascending / Descending change the ordering direction of the data
Note that while your application is executing, the sorted data is live. Sorting may not complete correctly as the data may change during the sort. Only when your program has finished executing is the sorted data guaranteed accurate.
Managing the data being displayed
There are three ways to change what's displayed in the view.
Change the amount of detail shown for each function:
•Address check to show the address in memory for the function
•Filename check to show the file location in which the function was found
•Modulename shows the function's module
Reduce the scope of the graph by hiding less significant functions:
•Threshold set a percentage threshold below which contributing functions are hidden
Higher numbers exclude more nodes.
You'll need to do a manual Refresh to update the display
By default the threshold applies to the top level functions only.
The threshold percentage is based on a functions accumulated contribution to the total runtime or total number of function calls.
The default All option includes all nodes.
•Apply Threshold to Children check to hide any function (as opposed to just top level nodes) in the graph that lie below the threshold contribution
Alternatively, filter out unwanted functions, or only show specific functions of interest.
Filtering data in the tables
The display filters affect what functions are hidden and shown in the call graph. They do not affect which functions are hooked in the first place.
•Filters shows the Call Graph Display Filter Manager:
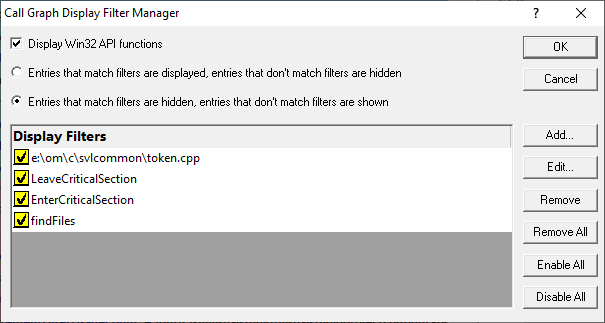
The dialog initially has no items in the list. Add some items manually or use the convenience filter options on the popup menus.
•Add... displays the display filter dialog described below
•Edit... opens the display filter dialog populated with the selected item's criteria, ready for editing
Or double click an entry in the list to show the filter dialog.
•Remove remove selected filter(s) in the list
•Remove All remove all filters
•Enable All enables all filters in the list
•Disable All disables all filters
You can also enable or disable individual items in the list via the yellow check box at the left of each row.
•Display Win32 API functions if selected this displays Win32 API functions otherwise Win32 API functions are hidden
•Entries that match filters are displayed select this to display only matched items
•Entries that match filters are hidden select this to remove matched items from the display
Take care when selecting Entries that match filters are displayed as clearing the list and leaving this checked will leave no functions being displayed at all!
The Display Filter dialog
The dialog below allows you to create a filter based on matching one or more criteria.
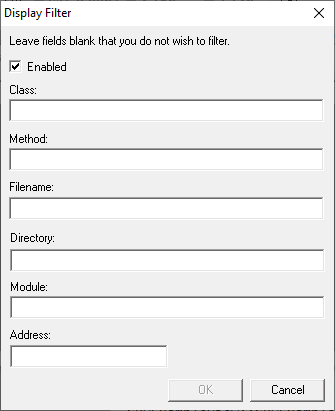
If you don't enter some of the details, they simply won't form part of the match criteria
•Enabled set this particular filter active or inactive
This is exactly equivalent to checking the listed item in the display filter manager
•Class enter the class name that the filter must match
If you enter a class but no method name then all functions in the class are filtered
•Method enter the method name
If you enter a method but no class then the filter will match for the named function in any class
•Filename filter all functions in the specified file
The full path to the file is required.
•Directory filter all functions in the specified directory
The full directory path is required.
•Module filter all functions in the specified module
The full path to the module is required.
•Address filter an exact address in memory
Finding text
To find text in the graph, use the Find Dialog where you can search for functions, files and modules.
 The source code view has its own Find and Goto dialogs.
Call graph menu options
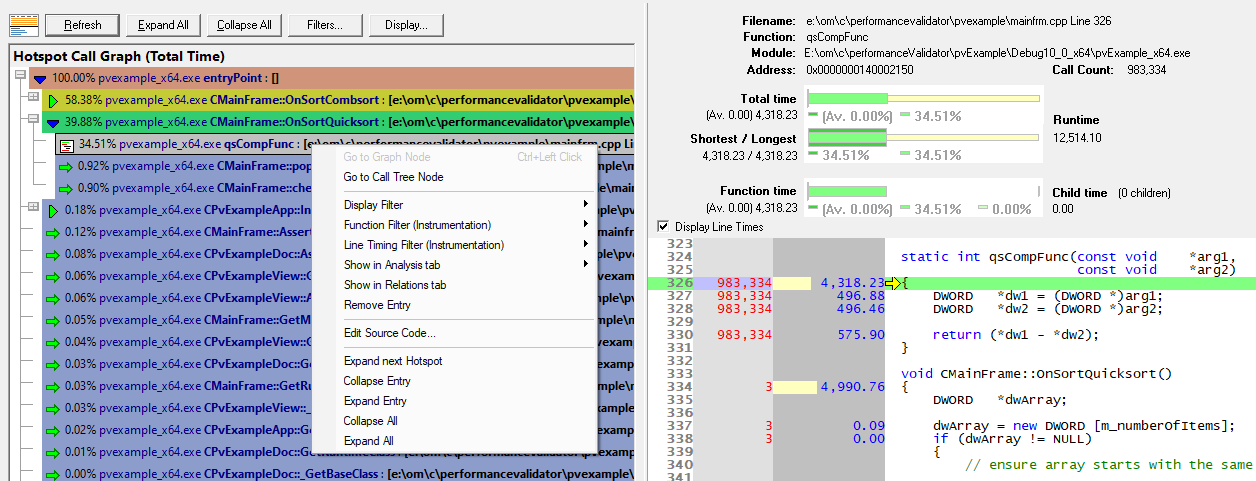
The following popup menu is available over the graph to add filters, examine relations or edit code.
Menu actions apply to the function in the graph at the menu-click location.
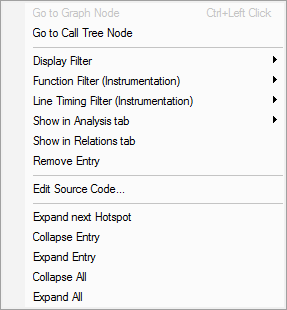
Menu options: Graph node
Functions may be linked to their main instance from multiple locations if called by different parent functions.
•Go to Graph Node jump to the main instance of this function in the graph
 +
+ has the same action
If the selected function is already the main instance, this option will be disabled.
Menu options: Call tree
The Call Tree view is similar to the Call Graph, but a function and its children can appear multiple times.
The times shown in a call tree are related to the relevant callstack rather than being an accumulated total time.
•Go to Call Tree Node open the Call Tree view at the first entry for the selected function
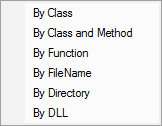
Menu options: Display Filter
The display filter sub-menu below provides a quick and convenient way to hide or show data based on attributes of the selected item.
Choosing any of these options will add the filter to the Display Filter dialog.
For example:
•Class hides all functions belonging to the same class
•FileName hides all functions that were in the same file
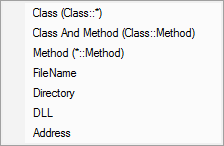
Menu options: Function filter (Instrumentation)
While the display filter controls visibility of hooked data, instrumentation filters control which functions are hooked in the first place.
The function instrumentation filter sub-menu lets you add hook filters at different levels of granularity.
The affect of adding function filters here depends on the current filter settings:
•If the current filters are set to hook everything, adding new filters will switch to excluding newly selected hooks
•Otherwise, the current filter will be retained, i.e. hook or don't hook newly selected items
The first three options add filters to the Class and Function Filter Settings:
•By Class adds a new filter, excluding the entire class from the results of subsequent sessions
•By Class and Method excludes only the selected function from new sessions
•By Function excludes all matching function names irrespective of their containing class or even if not in a class at all
The next two, Filename and Directory, are part of the Source Files Filter settings.
•By FileName adds a new filter, excluding all functions in the same file (as the selected item) from the results of subsequent sessions
•By Directory excludes functions in all files in the same directory as the selected function
Finally, the DLL level is controlled by the Hooked DLLs settings.
•By DLL excludes functions in all files belonging to the same executable or DLL as the selected function
Instrumentation filters become effective at the start of the next session. Adding a filter during a session will show the relevant rows in grey so that you can see which files would be filtered, but the performance data will continue to be included for the rest of the current session.
Menu options: Line timing filter (Instrumentation)
Line timing instrumentation filters control which lines are hooked for line timing and are independent of the function filters above.
The affect of adding line timing filters here depends on the current line timing filter settings:
•If the current filters are set to hook everything, adding new filters will switch to only including newly selected hooks
Note that this is the opposite of function filters.
•Otherwise, the current filter will be retained, i.e. hook or don't hook newly selected items
The line timing instrumentation filter sub-menu lets you add hook filters at three different levels of granularity.
Each option add filters to the Line Timing Filter Settings:
•By Class adds a new filter, appending the entire class in the line timing results of subsequent sessions
•By Class and Method include only the selected function in the line timing of new sessions
•By Function includes all matching function names irrespective of their containing class or even if not in a class at all
Instrumentation filters become effective at the start of the next session. Adding a filter during a session will show the relevant rows in grey so that you can see which files would be filtered, but the performance data will continue to be included for the rest of the current session.
Menu option: Show in Analysis tab
The Analysis tab shows results of a query on the call tree based on the selected function and the criteria chosen from the menu:
•Show in Analysis tab choosing any item in the following sub-menu, to be switched to the Analysis tab
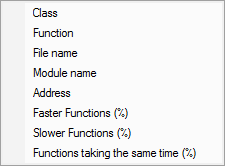
For example:
•Class the Analysis tab will show all points in the call tree that match the class of the selected function
•File name shows all points in the call tree that match the file name of the selected function
•Slower Functions (%) shows all functions that are slower than the selected function
Menu options: Show in Relations tabs
•Show in Relations tab switch to the Relations tab where you can examine functions that either call, or are called by, the selected function
Double clicking any item will also display it in the Relations tab.
Menu options: Remove entry
You can hide some entries from the Call Graph display.
Hiding entries is a very temporary action since a function and its children will only be hidden from view until the next Refresh.
•Remove entry hides the selected function in the graph
Only the selected node is hidden. Other calls to the same function in a different part of the call graph will remain.
Menu option: editing source code
•Edit Source Code... opens the default or preferred editor to edit the source code
Menu options: Expand and collapse
The last few menu options expand and collapse parts of the graph.
•Expand Next Hotspot finds the next most significant performance hotspot in the call graph and expands all the callstack nodes to make it visible
•Collapse / Expand Entry close or recursively open the selected function to its full extent
•Collapse / Expand All completely collapse or expand the entire graph
The file source code view
Clicking on a function in the call graph shows that function's source code file in the right hand pane.
The source code view is described in detail separately as its behaviour is the same for all views.