Performance Validator Tutorials

The Tutorials

Getting Started

Why is Profiling Important?

Types of profiling: Sampling and instrumentation.

Callstack

Statistics and Relations.

Call Tree

Call Graph

Analysis

Line Timing

How to restrict instrumentation to specific parts of your application.

How to exclude profiling MFC for statically linked and dynamically linked applications.

How to profile only selected parts of your application.

How to improve instrumentation speed.

Customizing embedded statistics.

Identifying slow code.

Reseting statistics.

Using Stop and Start.

Performance profiling a .Net Core application

Performance profiling a .Net Core application child process

Performance profiling a service

Performance profiling for a service child process

Performance profiling an IIS ISAPI DLL

Performance Profiling ASP.Net with IIS

Performance profiling ASP.Net with Web Development Server

Command Line Performance Profiling a Child Process
Line Timing
This tutorial demonstrates launching the sample application and using the Line Timing view to identify the parts of an algorithm that consume the most time.
- Click on the settings icon on the toolbar.

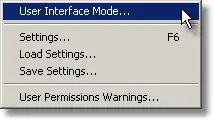
The settings dialog is displayed. On the Performance tab, choose the Time Stamp Counter option. This option causes Performance Validator to instrument your application and to time various operations using the processor’s time stamp counter. If you do not want to use the time stamp counter you can choose one of the other instrumentation options. Click OK to accept the new settings.Note: You cannot perform line timing when in sampling mode, you must choose one of the instrumentation modes. - Switch to dialog mode. On the Configure menu, choose User Interface Mode….
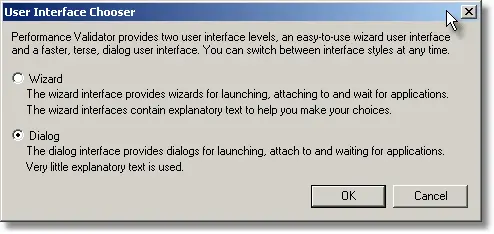
- The User Interface mode dialog is displayed. Choose Dialog and click OK to accept the choice.
- Click the launch button.

- The dialog mode launch dialog is displayed.
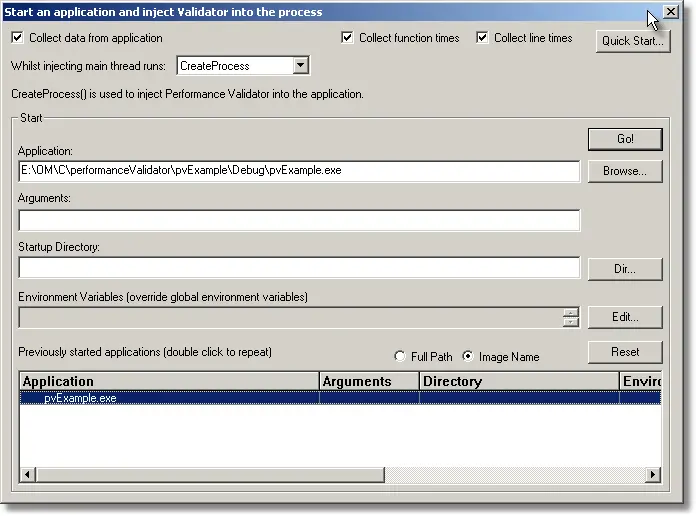
- Select the Collect line times check box. Choose the nativeExample.exe entry in this history list and click the Go button. The application is launched.
- Using the sample application, select the Sort menu and choose Quick Sort.
- Using the sample application, select the Sort menu and choose Comb Sort.
- Using the sample application, select the Sort menu and choose Heap Sort.
- Using the sample application, select the Sort menu and choose Merge Sort.
- Using the sample application, select the Sort menu and choose Bubble Sort.
- Close nativeExample.exe using the File menu Exit command. The application closes. Performance Validator processes any remaining data and displays the final results.
- Select the Line Timing tab and click Refresh. The display will look similar to the image below.
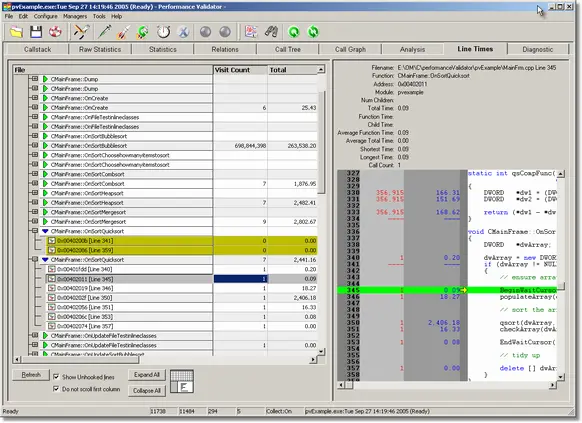
- The display can be sorted by clicking on a column heading. Selecting an entry displays the source code in the right hand window. Expanding an entry displays the individual visit counts and line times for each line.
Analysing the line timings.
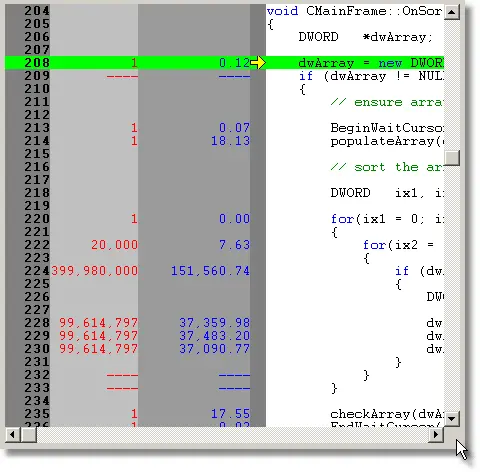
We already know from the other tutorials that Bubble sort is slower than Quick sort. Examining the individual line times shows why this is the case. Entries showing statistics of —- indicate that this line could not be hooked by Performance Validator and that statistics are not available for the line.
Bubble sort
The statistics for the bubble sort are:
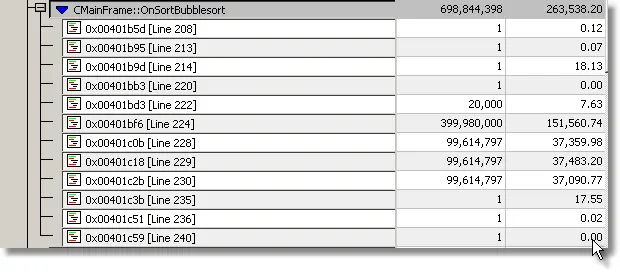
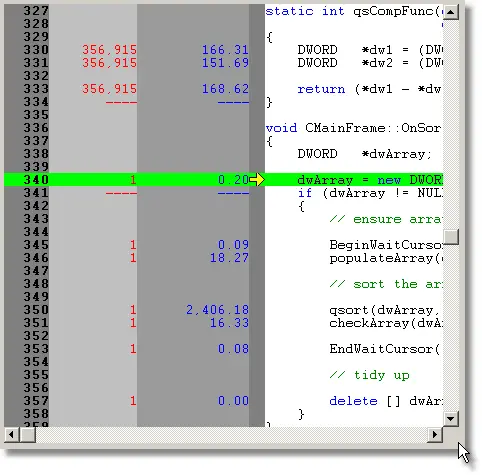
These statistics are also displayed embedded with the source code:
Quick sort
The statistics for the Quick sort are:

These statistics are also displayed embedded with the source code:
