Delayed memory deallocation can look like memory leaks
We recently had a bug in one of our tools that passed all memory leak tests (it didn’t leak memory) but in real-life use with large datasets would exhibit memory usage as if it had a memory leak.
You would see memory use trending upwards, and upwards, and upwards with seemingly no decrease in memory usage. Until you closed the application. Then the memory would trend down as expected. Memory leak tests using Memory Validator indicated no leaks. The problem was somewhere else in the code, it wasn’t a memory leak.
What would cause this behaviour?
It turned out that the failure was a thread that was exiting earlier than it should have done. If the thread had run correctly that thread would have been deallocating memory items that were no longer needed. Because the thread had exited earlier than expected many data items that should have been deleted by the thread were not being deleted. They were building up in a collection that was storing them. Then, when the application closed the application did its usual cleanup the thread and cleanup any remaining data items operation, deleting all the items that had built up in the collection. And that is why there were no memory leaks when the application was tested. It passed the tests.
Why was the thread misbehaving?
We had been re-factoring various parts of the code to put them into more self-contained bite size chunks. Partly to make them more manageable and easy to understand, and partly for code isolation so that one part of the software knows less (or nothing) about another part of the software. Unfortunately, during that refactoring the wrong (but valid!) data was passed as an argument to the thread. The thread did as was requested with that data item, but that wasn’t what the application as a whole was expecting. There is no test to detect this particular condition (that you can create as a unit test).
What to look for?
If you’re finding that you have ever-increasing memory consumption but your tools indicate no memory leaks, you need to look for some logic errors that are causing memory to fail to be deallocated, but also for those pointers to be retained rather than lost (because lost memory pointers mean you’ll have memory leaks).
- NULL pointers. Perhaps you’ve passed a NULL pointer (rather than a pointer to an object manager) to a function. The function can’t do anything with the NULL pointer, but if it had the object manager it could act on those objects, perhaps deallocating them if that was one of the desired actions.
- Failure to start worker threads. Perhaps a worker thread is failing for some reason. Either at thread startup, or shortly after starting. Either way, the thread doesn’t run, and the work the thread is meant to do doesn’t get done.
- Worker threads terminating early. Perhaps a worker thread is being instructed to cease execution earlier than expected.
- Faulty logic. Examine the logic surrounding the calling of the functions that are meant to be cleaning up the objects that are growing in number.
How to know what to look for?
Just knowing that memory is increasing isn’t that useful. In any real-world application, you have many objects being created. Either explicitly with malloc/calloc/realloc/new or implicitly by being added to collection classes like std::map, std::vector and so on. To find what types of allocation to look for you need to look at statistics for object types being allocated. Using Memory Validator you can see:
Summary Screen Statistics
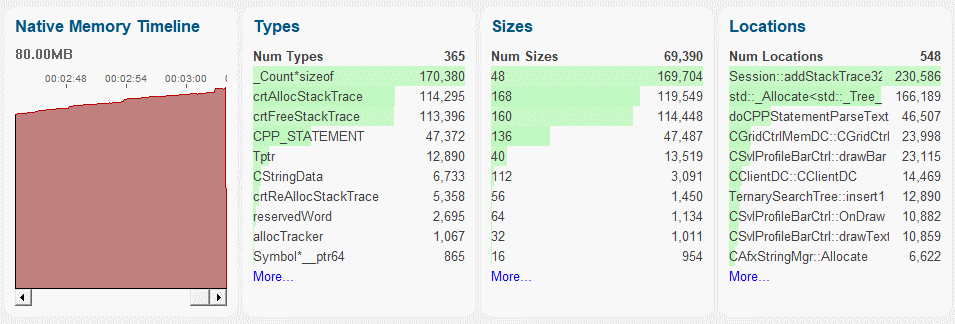
These statistics show a timeline, types, sizes and locations where allocations are being made. You can see that two types are common: crtAllocStackTrace and crtFreeStackTrace, and a third type _Count*sizeof is even more common. Looking at the Locations statistics, you can see Session::addStackTrace32 is one location, and another location is std::_Allocate<>, which is part of the std::map implementation (and most likely is the cause of the unreliable type _Count*sizeof from a template).
Timeline Statistics
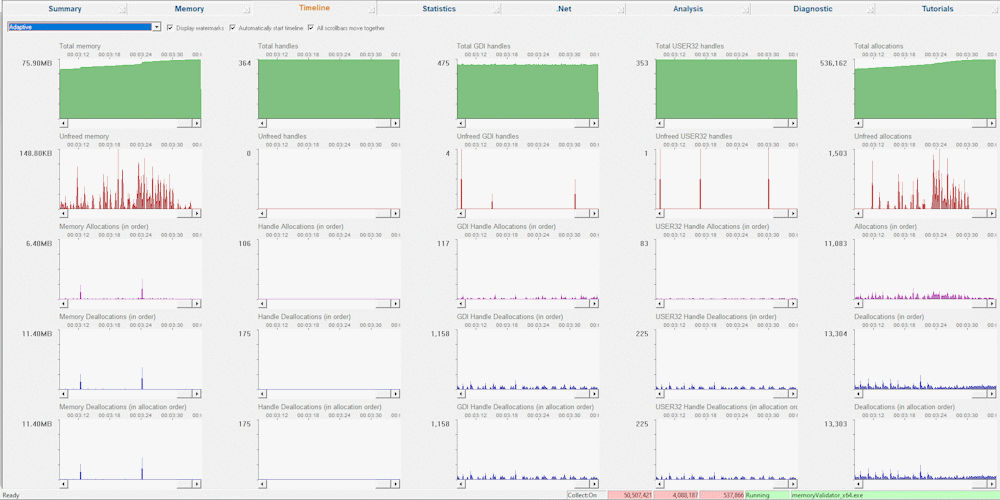
Using the Timeline we can see statistics for the allocation behaviour of the program. We can see that far more allocations are being made than are being freed.
Type Statistics
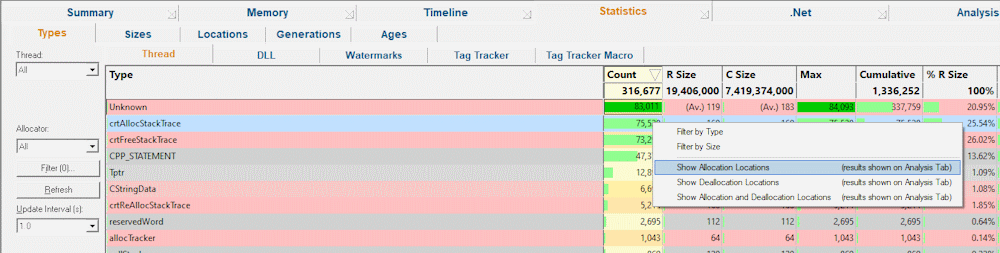
Examining the Statistics tab, then the sub-tab Types, we can see which types are most popular. Here we can see two types are very common: crtAllocStackTrace and crtFreeStackTrace, plus an Unknown type (a file that we can’t parse or a file that doesn’t exist on the machine). Examining the Sizes sub-tab, we can find out which sizes are being allocated that are not being deallocated, and examining the Locations sub-tab, we can find out which filename and lines are allocating memory which isn’t being deleted.
For .Net applications, there are additional tabs allowing you to inspect data relating to the number of object types existing for a given generation or given object age (an object may exist in generation 7, but be age 3, having survived 3 generations).
If we right-click on a type of interest to display the context menu, we can then run a query to show us the Allocation locations for the chosen type. That leads us to the Allocation Query Results.
Allocation Query Results
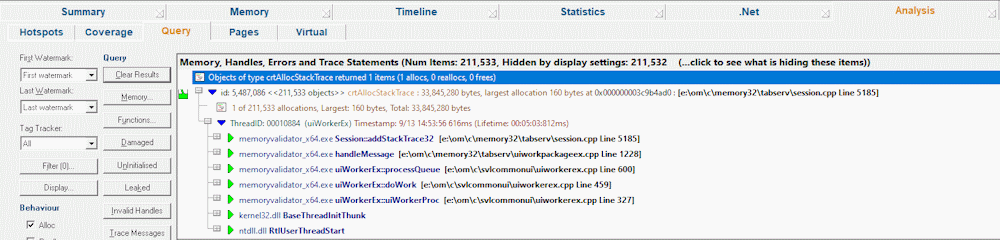
When an allocation query is performed on the Statistics tab, the results are displayed on the Analysis tab’s Query sub-tab.
For the example image shown above, the type being queried is crtAllocStackTrace. The result shown is one stack trace that represents 211,533 allocations using the same callstack. Total memory allocated at this location is 33,845,280 bytes, with the largest allocation being 160 bytes. Based on my knowledge of the application and it’s workload I think these numbers indicate there is a problem in that memory is not being deallocated when it should be. This indicates that further investigation is required to determine the cause of this failure.
Conclusion
You’ve learned that delayed memory deallocation can look like memory leaks, what to look for to identify possible causes of delayed memory allocation, and how to look for those causes using Memory Validator.