How to collect crash callstacks
When collecting data to submit for a bug report, collecting a callstack and supporting data is a common task.
In this article I’m going to explain how to collect a callstack, module list and register dump for Visual Studio and Windbg.
The module list is required so that the callstack addresses can be turned into filenames, line numbers and symbols. Without the load address you can’t resolve the callstack addresses.
Visual Studio
Attach the Visual Studio to the application that you know will crash, then cause the operation that will cause the crash.
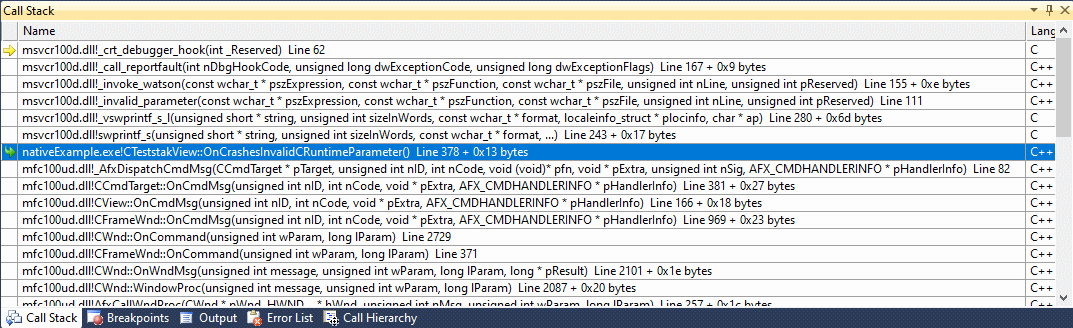
Callstack
The callstack window is normally displayed, but you can make it displayed by pressing Alt+7 or menu Debug->Windows->Call Stack.
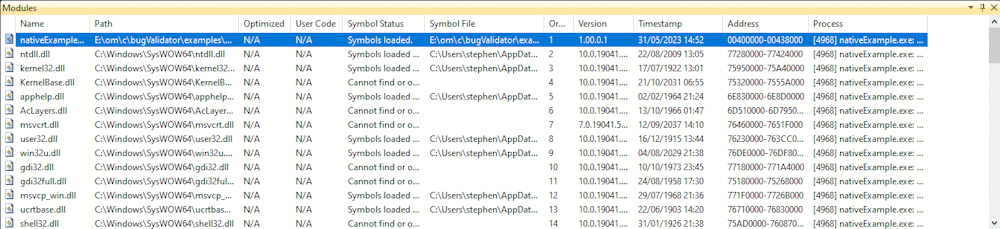
Module List
The module list is normally displayed, but you can make it displayed by pressing Ctrl+Alt+U or menu Debug->Windows->Modules.
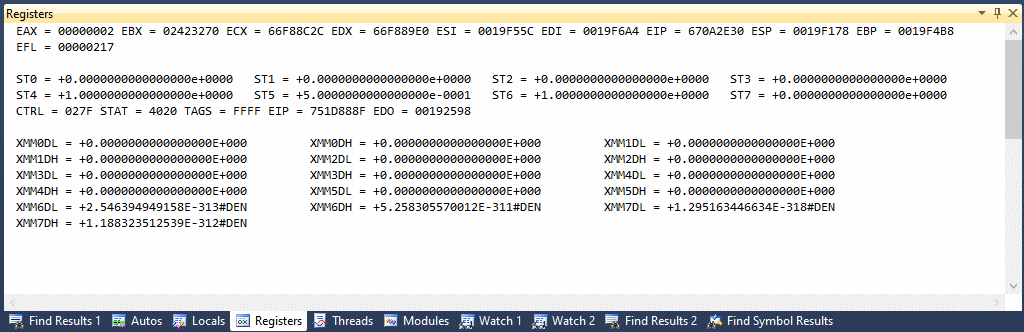
Register Dump
The Registers window is normally displayed, but you can make it displayed by pressing Alt+5 or menu Debug->Windows->Registers.
WinDbg
Attach the WinDbg to the application that you know will crash, then cause the operation that will cause the crash.
When the crash happens you’ll get an exception display telling what exception occurred.
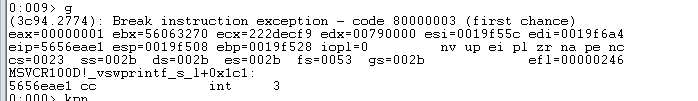
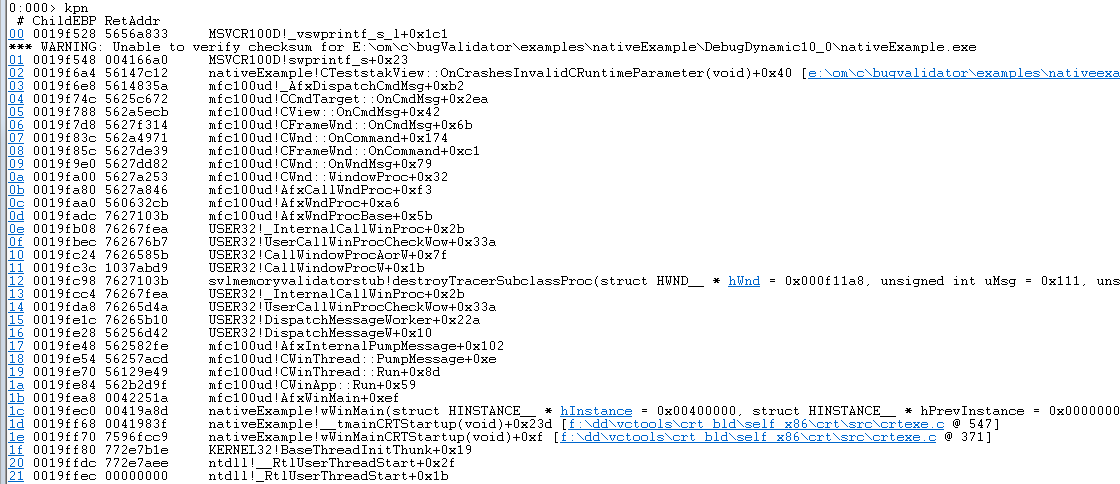
Callstack
To get the callstack: type kpn
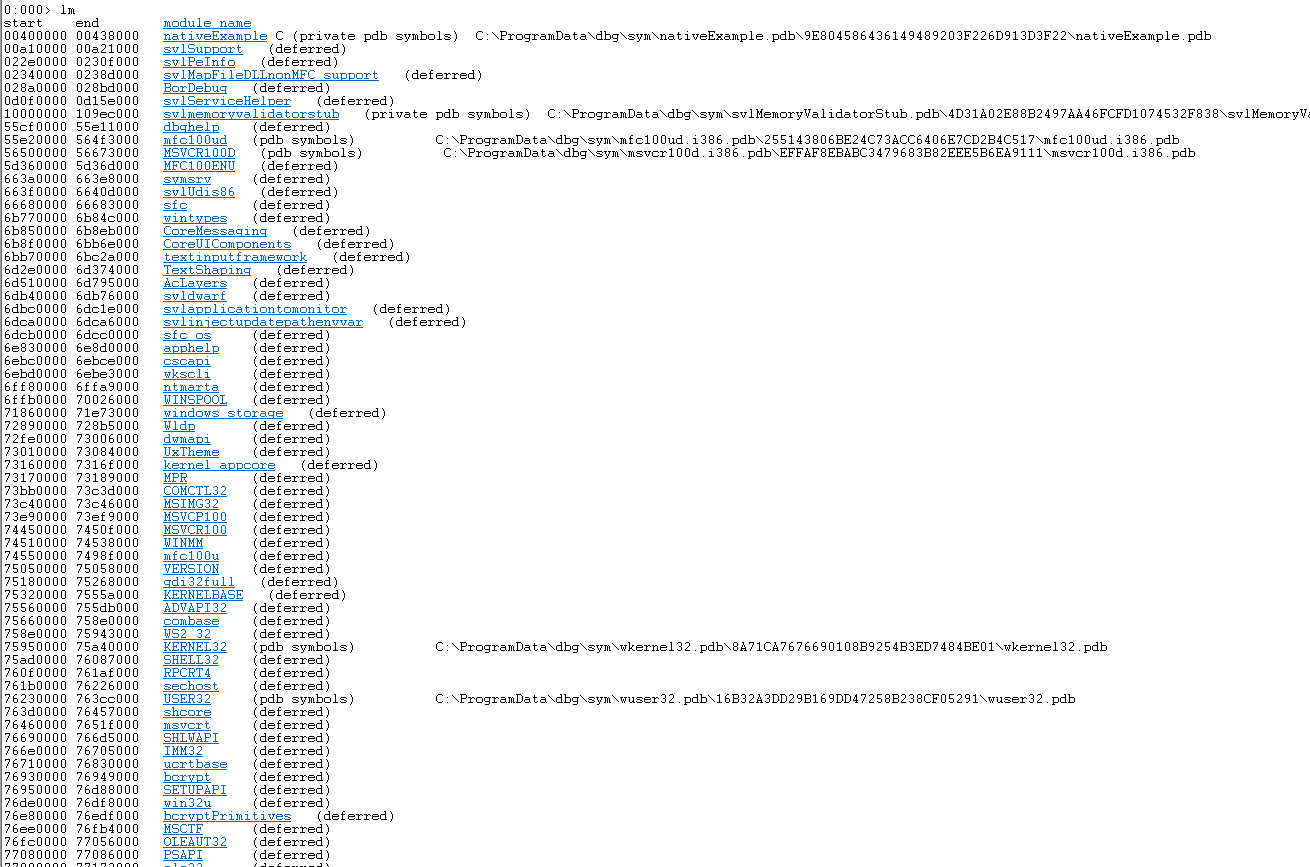
Module List
To get the module list: type lm. You can get more detail with lmv.
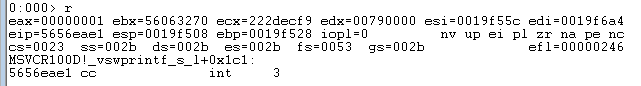
Register Dump
To get the register dump: type r
Conclusion
You now know how to collect callstack, module list and register information to submit for a bug report, using both Visual Studio and WinDbg.