Thread Validator Tutorials

The Tutorials
Getting Started
User Interface Mode
How to interpret the thread validator displays
Analysing an Application
Good Lock Strategy
Deadlock using two threads
Potential deadlock caused by incorrect locking strategy.
Potential deadlock caused by an infinite wait.
Leaving an unlocked critical section.
Deleting a locked critical section.
Leaving a critical section in the wrong order.
Identifying deadlock objects when not collecting callstacks.
Analysing an existing deadlocked application.
Getting information about a threading error.
Detecting deadlocks in a child process
Detecting deadlocks in a service
Detecting deadlocks in a service child process
Detecting deadlocks in an IIS ISAPI DLL
Command Line Deadlock Detection in a Child Process
Analysing a Deadlocked Application
This tutorial demonstrates how to use Thread Validator to attach to an application that is running and has deadlocked.
- Start the example application nativeExample.exe from the command line or windows explorer. DO NOT use Thread Validator to start the example application as we want to attach to the application later in the tutorial. The example application can be found at c:\Program Files\Software Verify\Thread Validator\nativeExample\ReleaseNonLink\nativeExample.exe or a similar path.
- From the Test Menu choose Start 3 thread deadlock.
- The example application starts 3 threads and displays 3 counters on the display. After a short period the threads will deadlock and the counters will stop incrementing. One solution to this is to attach the Visual Studio debugger and break into the application, inspecting each thread callstack. Typically the callstacks will contain no useful information because the callstack terminates inside ntdll.dll.
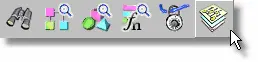
- Using Thread Validator, click the inject icon on the toolbar.

- The attach to application wizard or attach to application dialog is displayed. The image below shows the attach to application wizard.
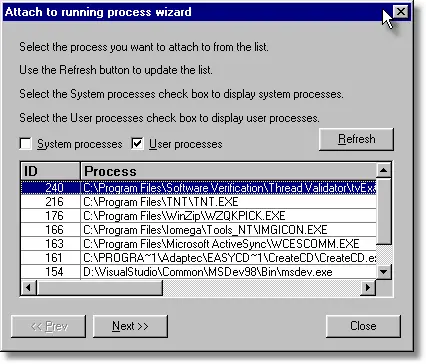
Select the User processes check box, then select the entry identifying nativeExample.exe. If more than one instance of nativeExample.exe is executing you will need to identify which entry to select by using the process ID, displayed in the left hand column. Click the Next >> button to move to the next page of the wizard. 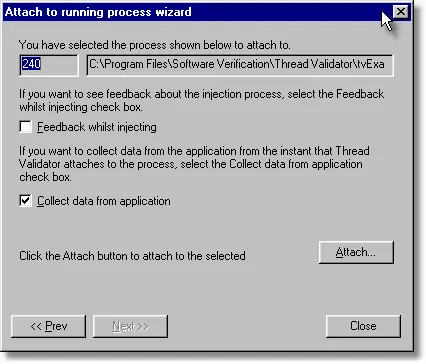
Check the information on the second page of the wizard is correct and click the Attach… button. Thread Validator injects itself into the chosen application.- From Thread Validator’s Query menu, choose Display stack traces for all threads, or click the Callstacks button on the Query toolbar.
- There will a slight pause while Thread Validator pauses all threads in the application, collects the callstack for each thread and sends the information to the user interface. When the data is available, Thread Validator displays the callstacks for each thread.
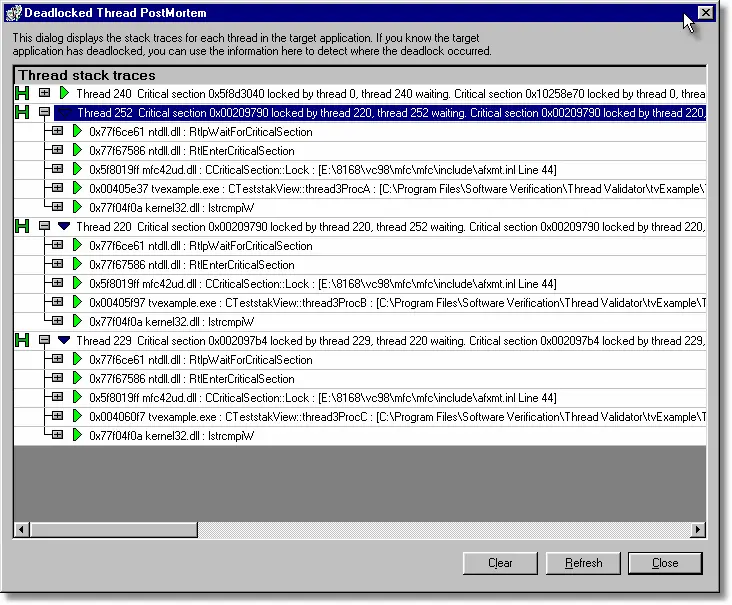
- It can be seen from the image above that three of the four threads are waiting upon each other whilst owning locks other threads are waiting upon. The callstacks indicate the location that each thread is waiting upon.
- The above image is from a debug application with frame pointer information. These callstacks contain more information than you would see in the Visual Studio debugger.For Release applications, some frame pointer information is omitted – this may make some callstacks less informative than their debug equivalent.When this happens you can switch to the advanced callstack procedure described in Thread Validator’s help, or you can build your application without FPO data (see Visual C++ compiler/linker settings).Visual C++ provides the /Oy option to omit frame pointers. For more informative callstacks your application needs frame pointers. Frame pointers can be retained in an optimized build by specifying /Oy- (Note the trailing minus sign).