Memory Validator Tutorials
Using the Hotspot View
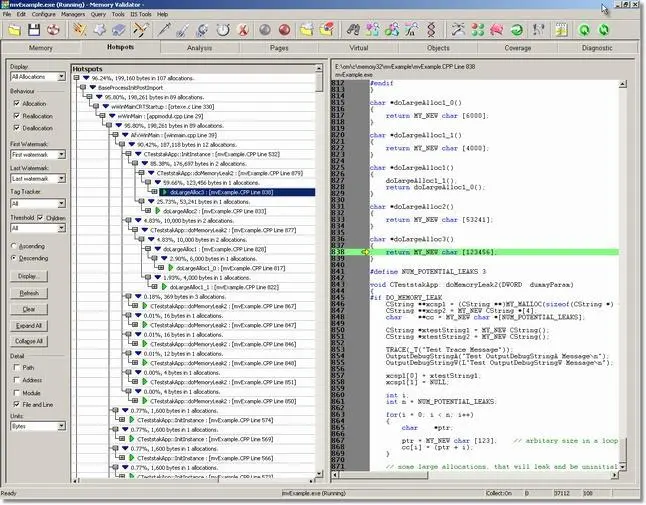
The Hotspot tab on the Memory Validator user interface allows you to view a graph of all allocations, reallocations and deallocations in your application. The graph is sorted based on the statistics for each node of the graph, allowing you to view the graph as a list of hotspots in the application.
Example
- Start the nativeExample.exe application.
- Choose the About nativeExample.. option on the Help menu. This causes some memory allocations that are leaked whilst displaying the About box.
- Press Refresh on the Hotspot tab. A graph of all allocations (matching the criteria displayed on the top left of the tab) is displayed.
- Click the Expand All button to expand all traces.

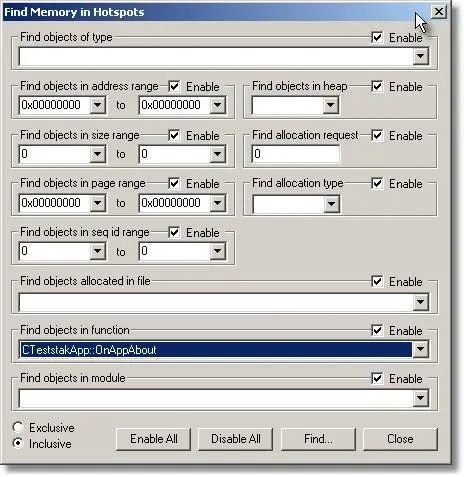
- At this point you may be thinking there is a lot of data to examine to find a particular trace you may be interested in. The Find Memory dialog is very useful in this regard. We know the memory allocated when we clicked the About nativeExample.. menu option was allocated in the About Box function OnAppAbout().Click the binoculars icon on the toolbar.

- The Find Memory dialog is displayed. Using the Find objects in function combo box, select the CTeststakApp::OnAppAbout function
 and click the Find… button.
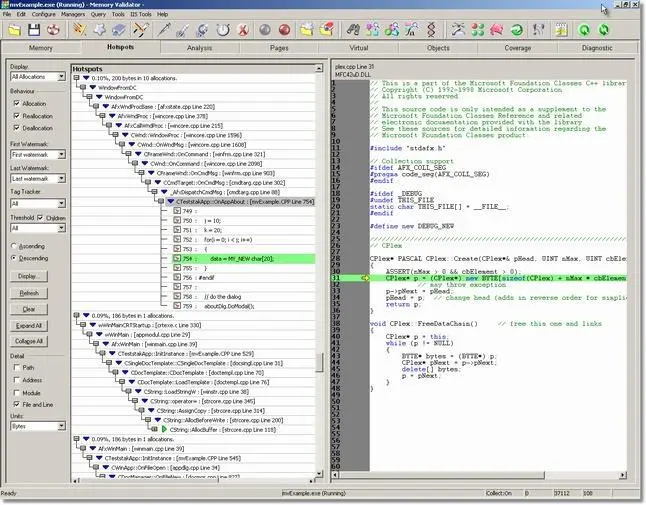
 - The results of the search are highlighted in the hotspot view. If the hotspots are collapsed you will need to expand them to see the results. The image below shows a highlighted line.

