Memory Validator Tutorials
Using Memory Validator with Visual Basic
Memory Validator can be used with Visual Basic.
Visual Basic uses the SysAllocString API family to allocate and deallocate BSTR objects (these represent strings).
Visual Basic also uses the VARIANT datatype and SafeArrays to manage data.
In addition COM objects (often written in C/C++) can also be used by Visual Basic. The COM objects may leak, and their implementation may suffer from the standard range of C++ memory leak and handle leak errors discussed in the other tutorials.
Getting Started
There is a three stage process to setup your Visual Basic application and Memory Validator to work together.
Each step is easy to do and is described below.
- Creating Debug Information.
When working with Memory Validator it is important that your Visual Basic application produces debugging information so that you can determine which in function allocations occur.To do this open the Project Properties dialog by selecting the Properties option on the Project menu.
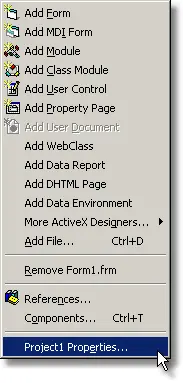
The Project Properties dialog is displayed.
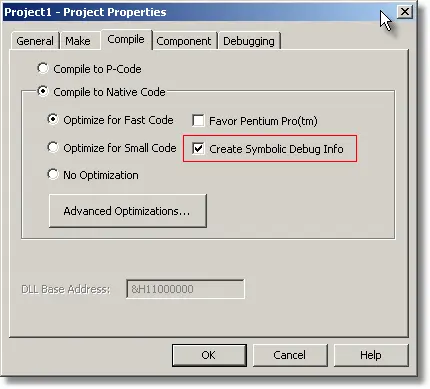
Choose the Compile tab then select the Create Symbolic Debug Info check box to ensure debugging information will be generated.
Click OK.
- Building an executable.
The next thing to do is to create a standalone executable of your Visual Basic application.You can do this by using the Make YourAppName.exe… option on the Visual Basic File menu.
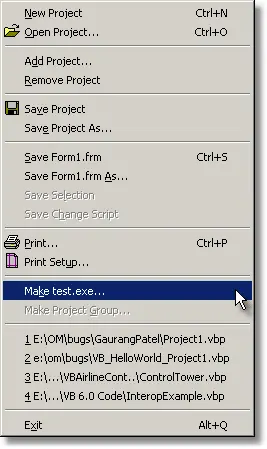
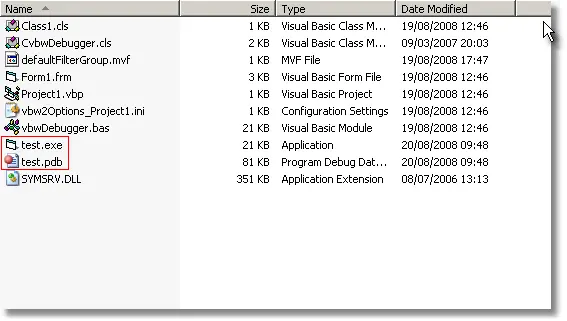
When your file has been built you will find the executable (YourAppName.exe) and its debugging file (YourAppName.pdb) in the directory you specified.
- Configuring Memory Validator for Visual Basic.
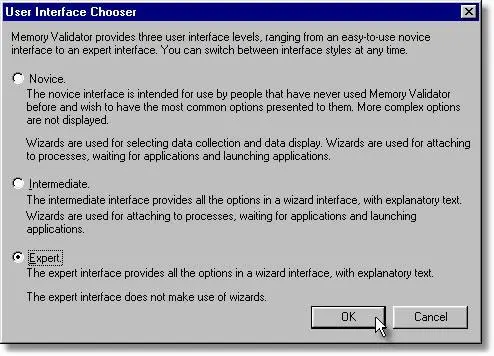
The next thing to do is to configure Memory Validator to detect the types of object that Visual Basic uses. Using the Configure menu, choose User Interface Mode. The user interface dialog is displayed. Choose Expert and click OK.
Display the data collection settings dialog by clicking on the toolbar icon shown below.

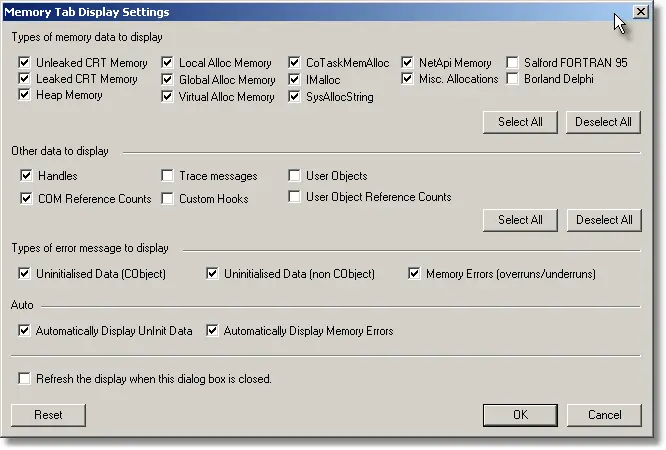
On the memory tab display settings dialog, select the check boxes shown below to enable the display of CRT memory, heap memory, COM memory (CoTaskMemAlloc), BSTR and SafeArray memory (SysAllocString), other SafeArray memory (Misc Allocations), COM object reference counts and handles.
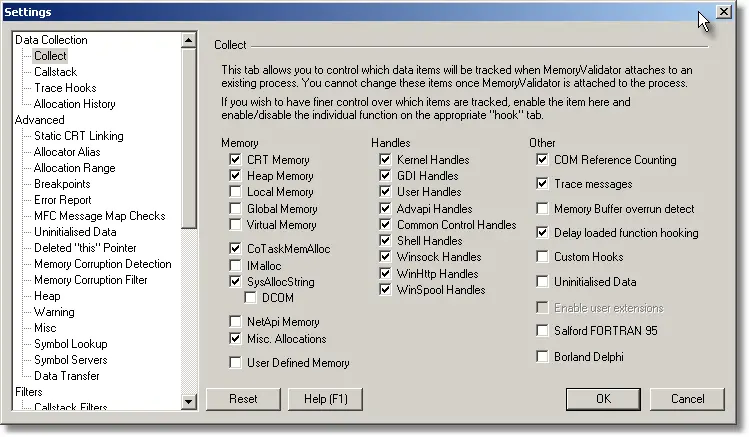
On the collect tab, select the check boxes shown below to enable the collection of CRT memory, heap memory, COM memory (CoTaskMemAlloc), BSTR and SafeArray memory (SysAllocString), other SafeArray memory (Misc Allocations), COM object reference counts and handles from many different Win32 APIs.
Click OK to accept the settings.
Detecting Memory Leaks
- Start your program using Memory Validator’s launch program option.
 The launch application wizard (wizard mode) or the launch application dialog (intermediate and expert mode) is displayed. The image below shows the launch dialog.
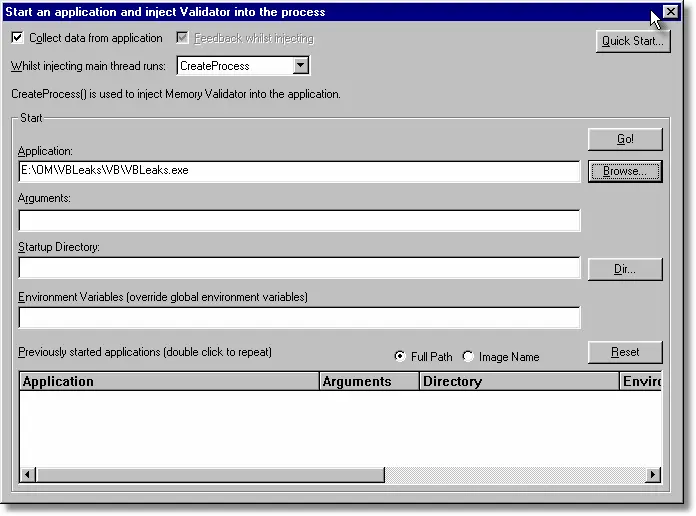
Select YourAppName.exe using the Browse… button. The example above shows the e:\om\VBLeaks\VB\VBLeaks.exe application has been selected for testing.
Click the Go button.
- Use your program as normal.
- To improve the execution speed of the application being monitored, Memory Validator puts all collected data onto a queue to send to the Memory Validator user interface. This means the application being monitored does not have to wait for inter-process communications delays. When the Memory Validator user interface receives the data it is also put on a queue to be processed so that the user interface also does not have to wait for inter-process communications delays.As your program executes, Memory Validator monitors the allocations and deallocations you selected using the data collection settings dialog. The data collected is sent to the Memory Validator user interface. Memory Validator displays an indication of how much data is sent the status bar, at the bottom left of the Memory Validator user interface.

- The Collect:On indicates that data is being collected and sent.
- The left hand number indicates the number of data items that Memory Validator has not yet processed. This is an indication of the amount of data in the Memory Validator user interface queue.
- The middle number indicates the number of data items that Memory Validator has processed.
- The right hand number indicates the number of memory allocations, handle allocations that have not been deallocated.
- Close your program as normal. For the purposes of this tutorial, choose File, Exit.
- Memory Validator collects information during the application shutdown, as well as data about pointers in static memory. This data is sent to the Memory Validator user interface. The Memory Validator user interface processes all this data (you can monitor this progress on the status bar). When all the data has been processed, Memory Validator then analyses all memory allocations and deallocations that occured during the lifetime of the program.
- All leaked memory is displayed on the Memory Tab in the colour assigned for memory leaks. The default colour for memory leaks is yellow. You will notice that in the display there are some memory allocations shown in teal. These are memory locations which are identified as leaked, but which also had pointers to the memory found in the static data areas (non-heap memory and non-stack memory) of the application when the application entered ExitProcess().
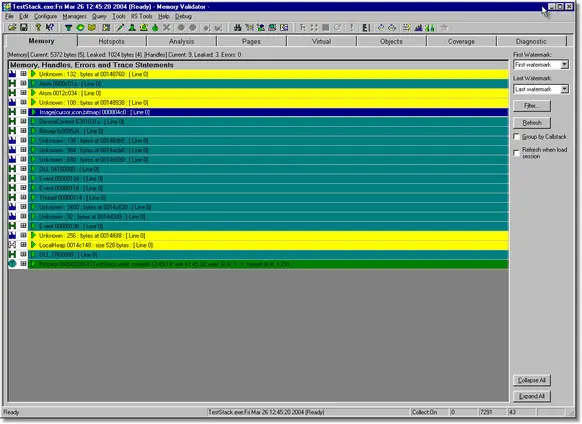 Examining the callstacks for the errors will identify the leak as caused by a Microsoft DLL (Visual Basic runtime or support DLL), a third party DLL, or by code that your software engineers have written. You can use filters (discussed in this tutorial) to suppress the display of leaks that come from code outside of your control.
