Memory Validator Tutorials

The Tutorials

How to detect memory corruption (tools) using Memory Validator

How to detect memory corruption (instrumentation) using Memory Validator

How to detect memory corruption (memory reuse) using Memory Validator

How to detect calling methods on deleted objects using Memory Validator

How to detect uninitialised data using Memory Validator

How to detect broken message maps using Memory Validator
Detecting Memory Corruption (memory reuse)
In addition to the memory corruption detection methods described in the preceding two tutorials, there is an alternate method of determining potential causes of memory corruption (and other errors).
First, let us identify some methods of corrupting memory:
- Write past the start or end of dynamically allocated memory.
- Write to memory using a pointer to dynamically allocated memory that has been deallocated.
- Write to incorrectly cast a pointer to dynamic memory.
- Calling a virtual method on a deleted object.
Below are shown some (greatly simplified) examples of how these types of errors can happen. Often the corruption happens in a different function/method to the memory allocation/reallocation/deallocation. For these examples the class definitions and function calls are omitted and replaced with … do some work ….
-
- Write past start or end of dynamically allocated memory.
    char    *p;

    p = new char [size];

    ... do some work ...

    p[calculatedSize] = data;   // calculatedSize is wrong, corrupting memory
-
- Write to memory using a pointer to dynamically allocated memory that has been deallocated.
    BankAccount *ba;

    ba = new BankAccount(1234);

    ... do some work ...

    delete ba;

    ... do some work ...

    ba->setValue(v); // call dead object, setting a value inside it, corrupting memory
-
- Write to incorrectly cast a pointer to dynamic memory.
    CheckAccount *ca;

    ca = new CheckAccount(1234);
    addToListOfAccounts(ca);

    ... do some work ...

    DespositAccount *da;

    da = (DespositAccount *)getAccount();
    da->calculateInterestAndTax(); // call dead object, setting a value inside it, corrupting memory
-
- Calling a virtual method on a deleted object.
    BankAccount *ba;

    ba = new BankAccount(1234);

    ... do some work ...

    delete ba;

    ... do some work ...

    ba->setValue(v); // call dead object virtual method. Will most likely get a crash.
The alternate method requires that the Memory Validator settings are changed so that the history of reallocated and deallocated objects is not purged. This will allow you to examine the history of memory reallocations and memory deallocations looking for locations at (or near to) the location of the memory corruption. This method assumes that you are investigating memory corruption because either:
- You have data that you know to be corrupt.
- Your application is crashing for unknown reasons and you suspect memory corruption to be the cause.
For both cases this tutorial assumes that you started your application with Memory Validator and have also attached your debugger to the application. In the debugger we assume that your application has crashed and that you know the memory address (A) that was being referenced that caused the crash, or that your application has not crashed but you have identified some memory (B) that you believe to have been corrupted by the application execution. The address A or B will be used to perform queries using Memory Validator’s user interface. For the purposes of this tutorial, this will be called the corruption address.
Before you start you need to change your settings.
- Open the settings dialog. Configure menu->Settings, or click the tools icon on the toolbar.
- Choose the Allocation History tab.
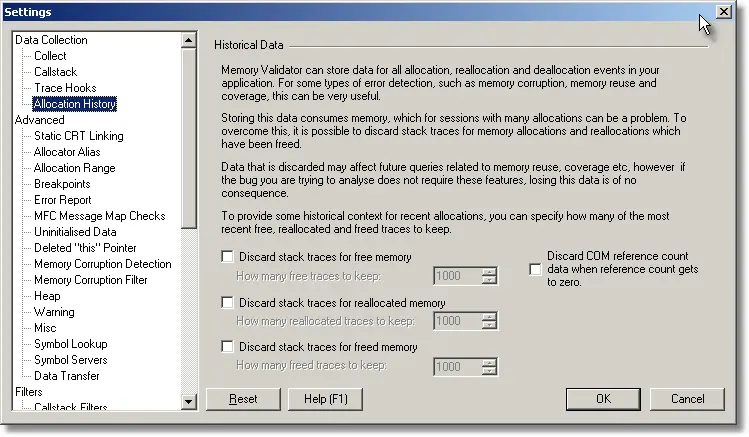
- Deselect the three Discard stack traces for… checkboxes.
- Click OK.
Now start your application using Memory Validator, attach your debugger to the application and get the corruption address using the debugger.
Memory Reuse
With Memory Reuse we are searching for objects that have re-used the memory address of interest (for example reallocations).
Using the Analysis tab, we can query for the address using the Memory Reuse… button.
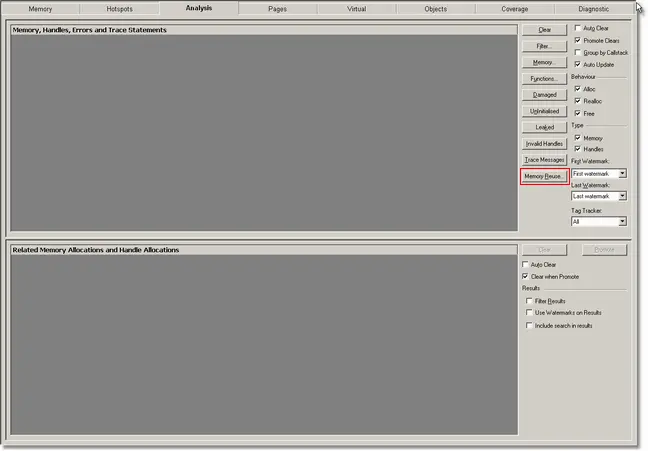
Click the Memory Reuse… button. The memory reuse dialog is displayed.
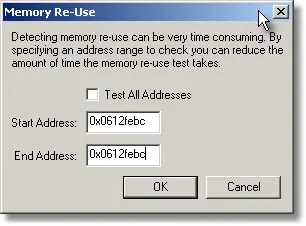
Type the corruption address into the start address and end address fields and click the OK button. If some memory allocations are found that have had the same address as the corruption address you may want to look at where the memory was allocated and determine if you think a stray reference to those allocations was responsible for the memory corruption.
If no memory allocation are found, you may want to repeat the search with a wider search range by lowering the start address (the corruption address may not at the start of a memory allocation) or by raising the end address for the search. Use your judgement as to how much you want to widen the search range.
Memory Usage
With Memory Usage we are searching for any allocations, reallocations, deallocation that have used the memory address of interest.
Using the Analysis tab, we can query for the address using the Memory… button.
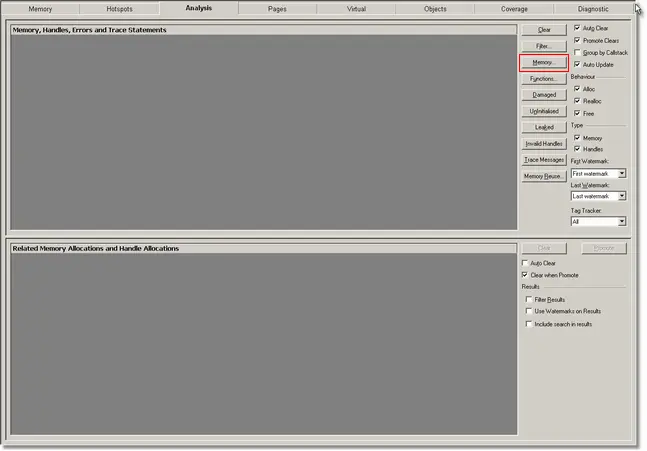
Click the Memory… button. The memory query dialog is displayed.
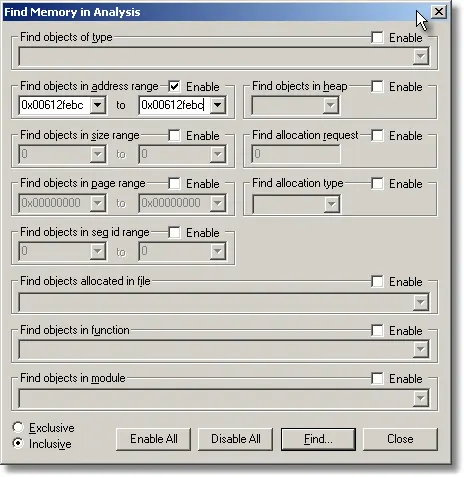
Click the Disable All button, then select the Find objects in address range check box, then type the corruption address into the Find objects in address range fields and click the Find… button. If some memory allocations are found that have had the same address as the corruption address you may want to look at where the memory was allocated and determine if you think a stray reference to those allocations was responsible for the memory corruption.
If no memory allocation are found, you may want to repeat the search with a wider search range by lowering the start address (the corruption address may not at the start of a memory allocation) or by raising the end address for the search. Use your judgement as to how much you want to widen the search range.
Please note that you can limit your query on the Analysis tab by selecting the type of memory allocation in the Behaviour section and by using watermarks to limit the range of the query.
Once you have some results on the Analysis tab, you have additional per-result queries you can perform via the context menu. Using the results from these queries you can often identify memory allocations/objects that have been incorrectly cast or incorrectly used after being deleted.