OutputDebugString Checker
OutputDebugString Checker is a software tool that scans source code looking for calls to OutputDebugString() that are not conditionally compiled. Additional functions names can be specified so that you can search for your own functions that implement similar behaviour.
Why? What’s the point?
Good question. Two reasons:
- Leaving these calls in your program slows down execution. The method to communicate the string to a debugger is by raising an exception. This is slow, and if a debugger is monitoring the exception, it’s slower than without the debugger.
- Leaving these calls in your program allows data to leak out of your program. The contents of these calls many contain function names, debugging information, data the program is processing. Do you want your customers to see this information?
OutputDebugString Checker provides a GUI for interactive discovery of OuputDebugString() calls and also a command line so that you can automate this and drop it into your smoke tests, regression tests, continuous integration tests.
Filters are provided so that calls that are valid are ignored and only the calls that shouldn’t be in the code are flagged for your attention.
Couldn’t I just search for these in my text editor?
Yes, you could. But you’d get a listing showing every usage of OutputDebugString(), regardless of conditional compilation. That forces you to manually check each one, rather than just look at the ones that you didn’t expect to find. Software engineers are human, and mistakes get made. This tool is here to make identifying such mistakes easier.
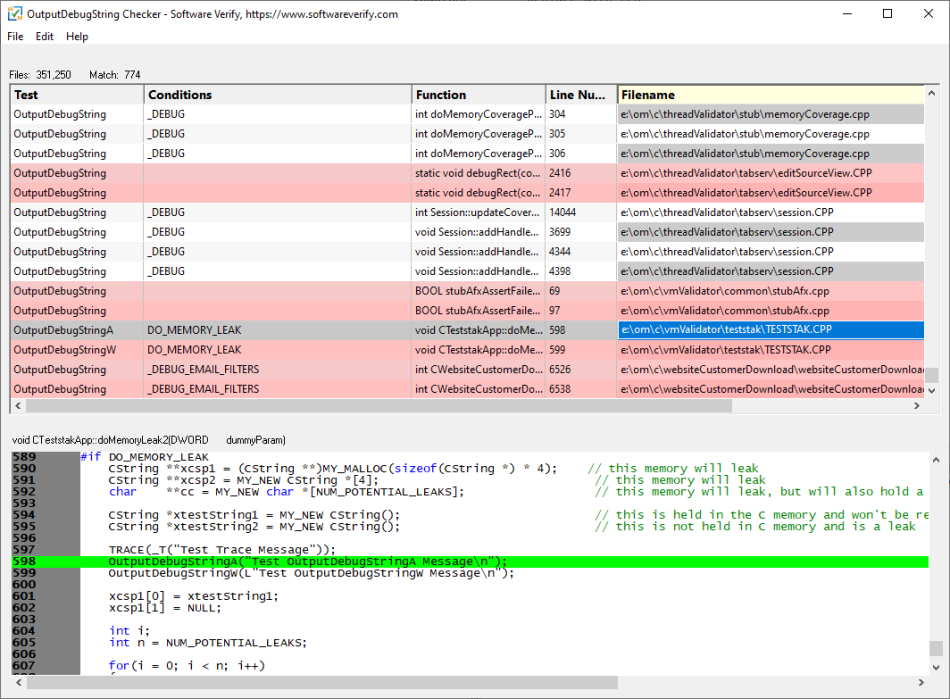
OutputDebugString Checker scans all source files under a specified disk hierarchy. When function calls are found that match the criteria specified in the settings the usage is reported on the function report.
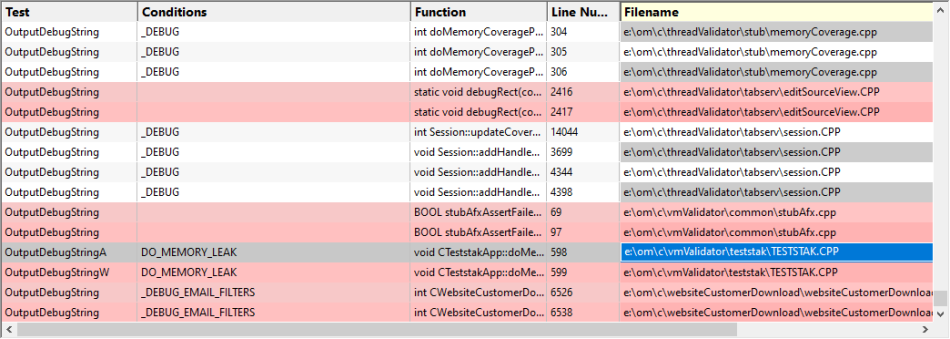
In the function report shown above 11 matches have been found for OutputDebugString criteria that match the settings.
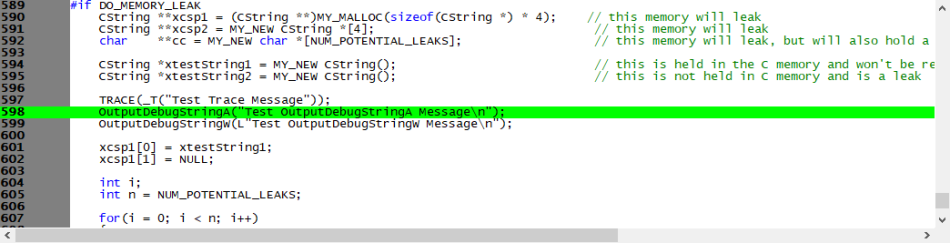
Clicking on an entry in the function report will show the source code in the source code viewer. The line of interest is highlighted in green.
Double clicking on an entry in the function report will start Visual Studio to edit the source code.
Command line
You can automate this checking by using OutputDebugString Checker from the command line. Add automated checking to your code review process, source code check in process, or to your software release process.
Example 1 Scan a directory and output the results to a log file. If there are no results, there will be no log file.
outputDebugStringChecker.exe /dir e:\om\c\
                             /output e:\test.txt
Example 2 Scan a directory looking for a custom debugging function and output the results to a log file. If there are no results, there will be no log file.
outputDebugStringChecker.exe /dir e:\om\c\
                             /output e:\test.txt
                             /removeAllFunctions
                             /addFunction myDebuggingFunction