Exception Tracer
Exception Tracer is a software tool that reports debug events as they happen. Exceptions do not cause breakpoints but are logged for later inspection.
For applications that throw a lot of exceptions, only one or two of which are interesting to you this is really useful, as you don’t have to keep interacting with the debugger each time an exception is thrown. Even more useful when you think there is a problem but don’t actually know what the problem is.

Single stepping
The software can be run single stepped so that when you get to the source of the problem you can see exactly where you’ve been. This can be very useful for identifying the cause of awkard bugs such as stack overflows where traditional debuggers can’t show you a stack trace deep enough for you to see the function calls before the recursion into running out of stack space.
Minidumps
Minidumps can be created for all and any type of exception (including custom exceptions) and when the process exits.
Once a minidump has been created you can then load it into Visual Studio, WinDbg, Virtual Memory Validator or Minidump Browser for further analysis.
Thread naming
Thread names are provided by reading the data set using SetThreadDescription() on Windows 10, from thread naming exceptions, and can also be named via the user interface.
All processes
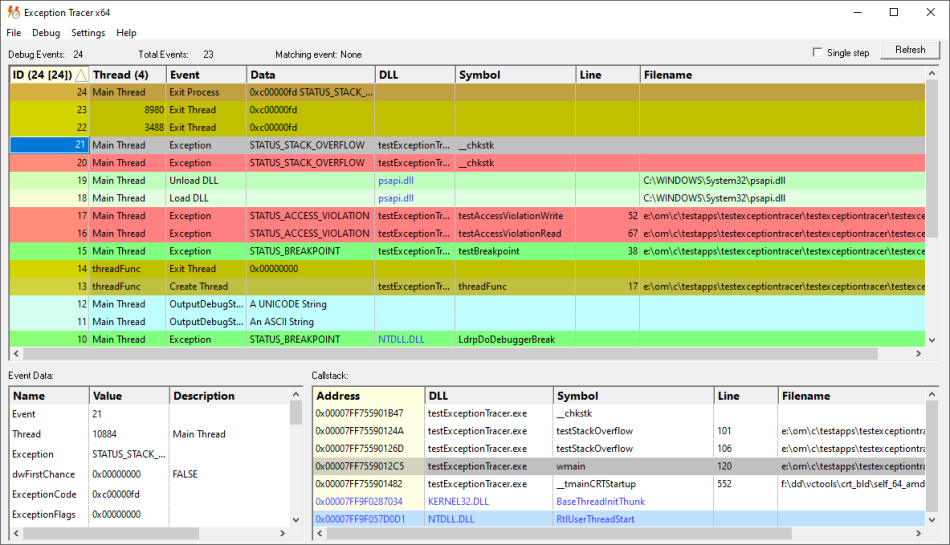
Launch your process or attach to an existing process then watch the debugging events listed in the top window.
Postmortem analysis
Collect an exception trace and/or minidumps from a colleague or from a customer site and view the trace after the fact.
Select a debugging event in the top window to see detailed event data and callstack for the event.
Each column can be sorted by clicking on the column name.

Command line
Example 1 Attach to an already running process and monitor it for exceptions.
exceptionTracer.exe /process 1344
Example 2 Launch an application and monitor it for exceptions.
exceptionTracer.exe /exe e:\om\c\test\release\test.exe
                    /dir e:\om\c\test\release
                    /args "-add 3 4"