The Analysis tab shows groups of search results and allows you to find many types of related data for different synchronization objects.
If the Analysis tab isn't visible, use the Data Views menu to set which views are shown.
 Read on, or click a part of the image below to jump straight to the help for that area.
The Analysis Data
The Analysis tab has two parts separated by a resizing handle.
The top view is where the initial data to work with is displayed - i.e. the result of manual or predefined searches.
The lower display shows any related synchronization objects found using the popup menu options - e.g. other calls with similar addresses or callstacks.
Manual searches allow information about synchronization objects to be displayed based on:
•type (e.g. GDI handle object type)
•file
•function
•DLL
•address or handle value
•size
Predefined searches display:
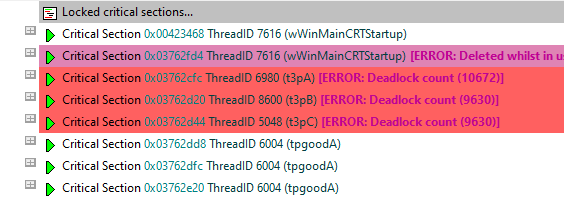
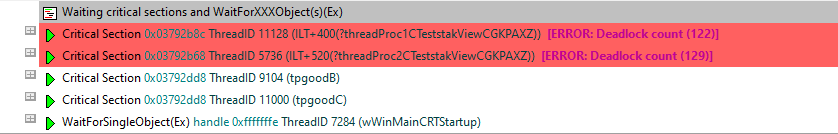
•locked or waiting critical sections
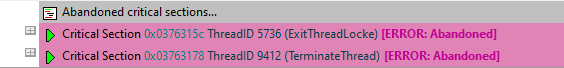
•abandoned critical sections
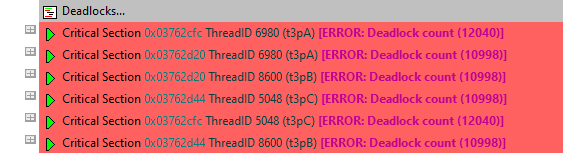
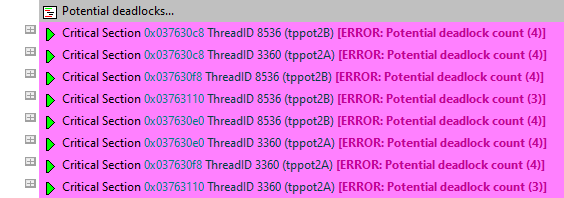
•deadlocks or potential deadlocks
•bad lock strategies
•miscellaneous locking errors
•trace messages
The text on each line is the same and indicates:
•datatype (if known)
•address/handle value
•source file and line number (if available) for the function
To edit the source code, double click on any part of the lines of source code displayed or use  Edit Source Code...
The upper window - working data
The upper window will contain any results of queries made via the manual or predefined query options on the left.
These results become your 'working data', and will grow (with a header line between each group) as each set of results is added.
Using the relations option on the popup menu, you can then find related allocations or objects which are displayed as separate results in the lower window.
Collected data is displayed in a tree, optionally constrained by watermarks:
•the text on the line indicates the data type (if known), its size, address/handle value, and the source file and line number (if available) where the event occurred
•the colour of the background for the line indicates the status of the data, such as the thread is deadlocked  , potentially deadlocked
  , or involved in other errors such as a bad lock strategy
See the section on predefined queries for example views
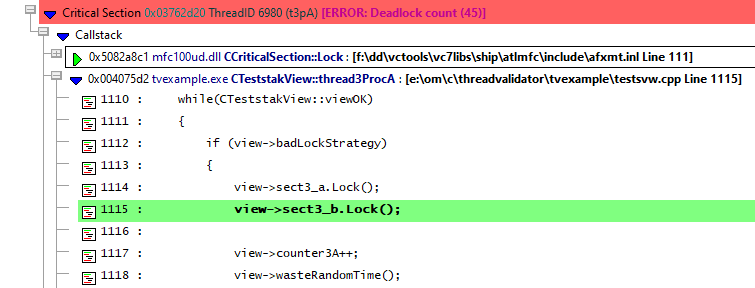
Each item can be expanded showing some information about the item, such as thread id, timestamp and the callstack for the item.
Each line of the callstack shows the instruction address, module name, undecorated C++ function name and the source file and line number (if available) for that function.
The callstack itself can be expanded (see example below) to display the source code which can also be edited.
 Please note that not all data for the queries is acquired in the same manner. This is because of the measure taken to reduce the amount of memory needed to store data about the locking activity of the application. As a result, queries that you may expect to yield results may sometimes fail to do so because the information required for the query was not collected or was collected in such a manner that it is not available for the query.
The lower window - results within results
Having obtained related data in the lower window you can inspect it in the same way, filter it and promote it back up to the top window.
Analysis tab options - upper window
At the far left of the window are the same Watermark options as on the Active Objects tab.
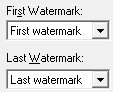
Choose two watermarks to restrict the displayed data to lie between them.
•First Watermark  Choose a watermark from the list Last Watermark Choose another watermark Refresh updates the data shown in the display
There are two permanent default watermarks, called First watermark (before anything else) and Last watermark (after anything else).
Attempting to choose a first watermark later than the last watermark, or vice-versa will result in the alternate watermark automatically updating.
Analysis tab options - clearing data
The working data in the upper display can be cleared manually or automatically in different ways:
•Clear manually remove all working data from the upper window only (the lower window has its own clear button)
•Auto Clear clears any existing working data on each new search
•Promote Clears automatically clears the working data each time data from the lower window is promoted to the top view
Running data queries
From the buttons at the left you can run some common or very specific queries to search for synchronization objects, thread errors, and messages.
Custom queries
Several of the main tabs have some comprehensive methods of querying synchronization objects or functions, and which are accessible from the main query menu and query toolbar.
The Analysis tab has dedicated buttons for two of these queries:
•Find... Shows the Find Synchronization Objects dialog to use a variety of search criteria to search for objects and display them in the Analysis tab
•Functions... Shows the Find Functions dialog but displays the results here in the analysis tab
Predefined queries
There are a selection of common predefined queries available at a single click:
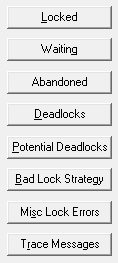
•Locked finds all locked critical sections
•Waiting all waiting critical sections and waiting handles
•Abandoned finds abandoned critical sections (critical sections locked but not owned by any thread)
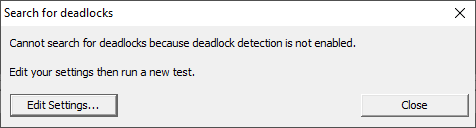
•Deadlocked finds deadlock locations
You'll need to enable the detection of deadlocks otherwise you'll just see this warning, with the option to edit the settings.
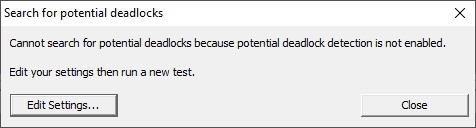
•Potential Deadlocked finds locations for potential deadlocks
You'll need to enable the detection of potential deadlocks otherwise you'll just see this warning, with the option to edit the settings.
•Bad Lock Strategy finds all critical sections involved in bad lock strategies

To ensure this reports the maximum number of errors you'll need to enable the detection out of order critical sections and other locking errors.
•Misc Lock Errors finds a variety of other synchronization errors not covered by the other predefined searches

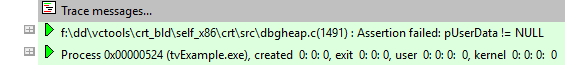
•Trace Messages shows any trace messages if you've switched the trace hook setting on
Analysis tab options - lower window
The lower window has its own comparatively simple set of options:
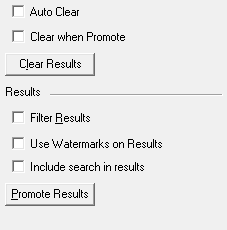
•Auto Clear clears the lower window before adding a new relations search from the upper window
•Clear when Promote clears the lower window when promoting these results to the upper window
•Clear Results simply empties the lower window
•Filter Results optionally filters the lower window data using the same filters as the upper window
•Use Watermarks on Results applies the upper window's watermark settings to the lower window
•Include search in results brings the upper window item that initiated the relations search along with the results
•Promote Results pushes all or selected lower window results into the upper window.
This optionally adds to or replaces what's in the upper window already, depending on the state of the Promote Clears option in the upper window.
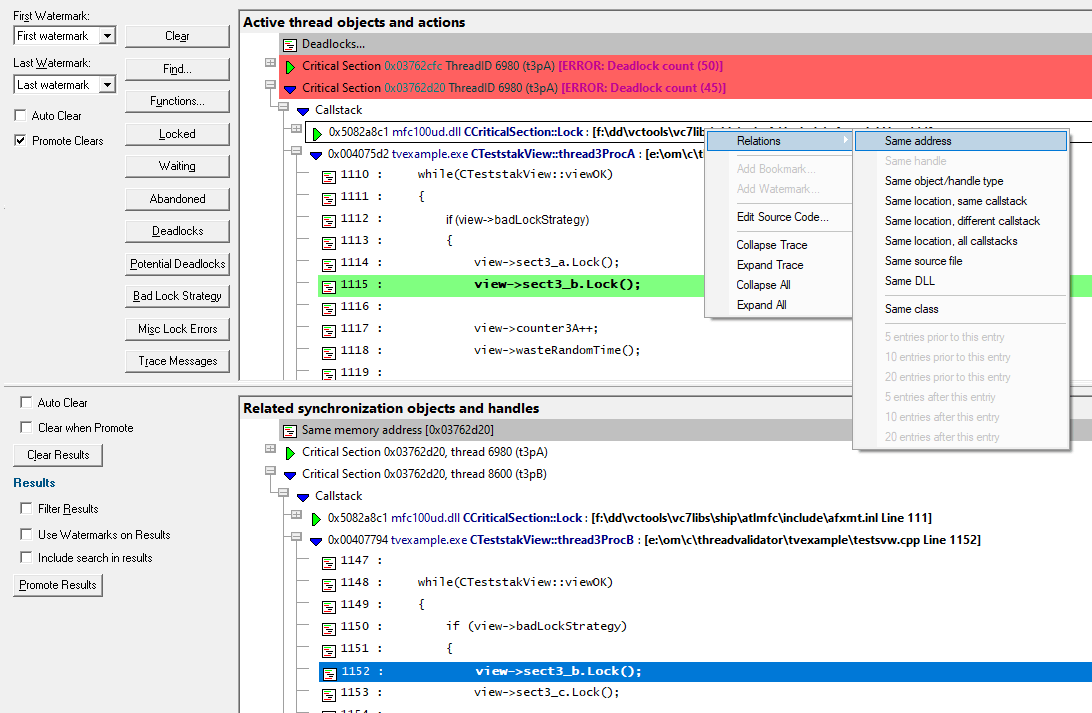
Analysis view popup menu
The following popup menu is available over the upper window.
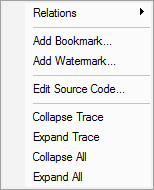
Menu option: relations
The relations menu has a sub-menu with many different options for choosing a set of related data to display in the lower analysis window.
Think of this as a sub-query on the working data - like searching for friends of friends on a social network!
Given an entry in the upper window, available relations are as follows:
•Same address |
Finds any other critical sections using the same memory address |
|---|---|
•Same handle •Same object/handle type |
Finds any other WaitForSingleObject using the same resource handle Critical sections and wait calls that have the same object type or handle type. |
•Same location, |
Finds other critical sections that have the same usage location and: using different callstacks regardless of callstack |
•Same source file •Same DLL |
All critical sections in the same source file... or the same DLL |
•Same class |
All critical sections from the same C++ class |
•Entries prior •Entries after |
For critical section events, finds the previous 5, 10 or 20 events or the next 5, 10 or 20 events |
Menu option: bookmarks and watermarks
Bookmarks allow you to find a data item easily at a later date, while watermarks are used above to show only those items between two points in time
•Add Bookmark... adds a bookmark for the selected item
•Add Watermark... adds a watermark for the selected item
Menu option: editing source code
•Edit Source Code... opens the default or preferred editor to edit the source code
Menu options: collapse / expand trace
•Collapse or Expand Trace simply shows and hides data item information, the same as using the  or
or  buttons
•Collapse All completely collapses all data items in the upper window, including any source code views that were open
•Expand All expands all data items down to but not including the source code snapshots