Garbage collected programs, in theory, never leak memory. In practice that isn't the case, which is probably why you're using Memory Validator.
If references to objects are not reset to null the garbage collector will not collect the object, even if it will never be used again by the program. Such conditions are hard to detect even with tools like Snapshots and Heap Dumps.
To aid in this task we've created a dedicated .Net leak analysis query facility where you can use predefined queries or design your own query.
Each query is formed from five factors and the display of the results allows for a range of filtering options.
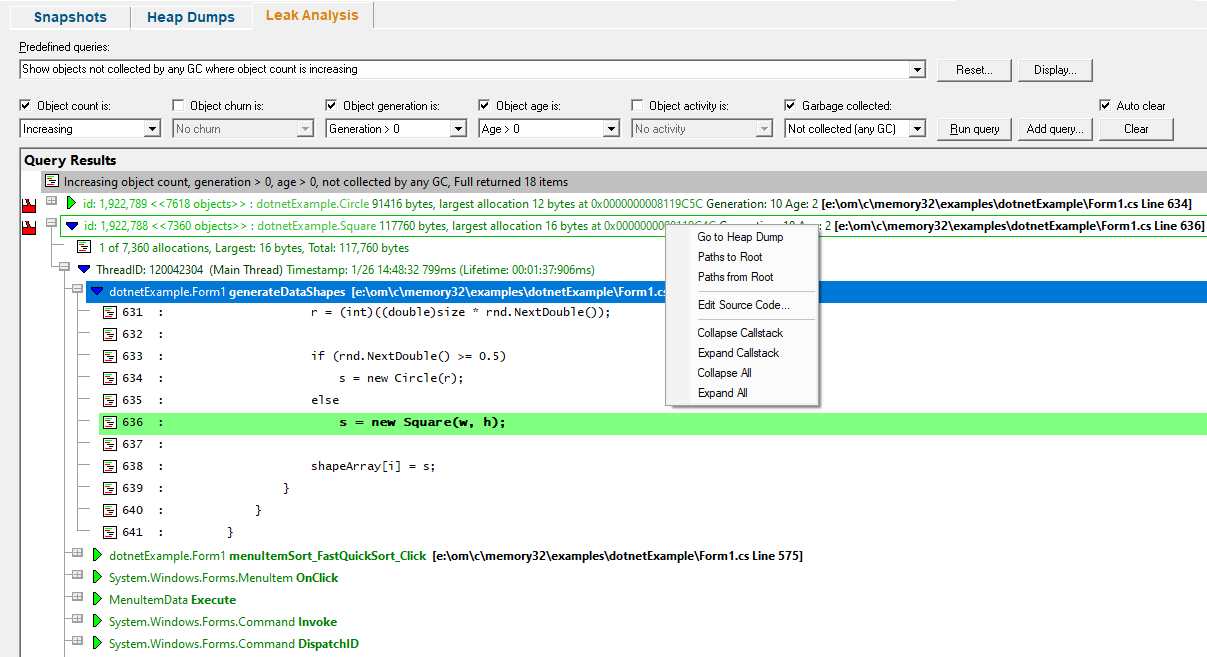
 Click a part of the image below to jump straight to the help for that area.
Displaying Data
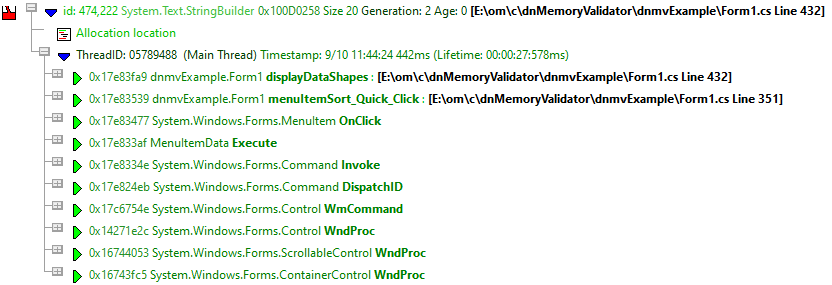
Data from each query is displayed in the tree control.
Each query is prefixed with a line that describes the query that was run.

The query results are displayed after the description.
Each line has an icon at the left, indicating its type, and has an explanatory tooltip:

The text on each line indicates:
•datatype (if known)
•size
•allocation address/handle value
•source file and line number (if available) where the allocation occurred
•optional event sequence id at the beginning of the line
There are two types of callstack representation.
The first callstack representation is that of an object that has been allocated on a callstack that has never had any objects allocated on it that have been garbage collected.
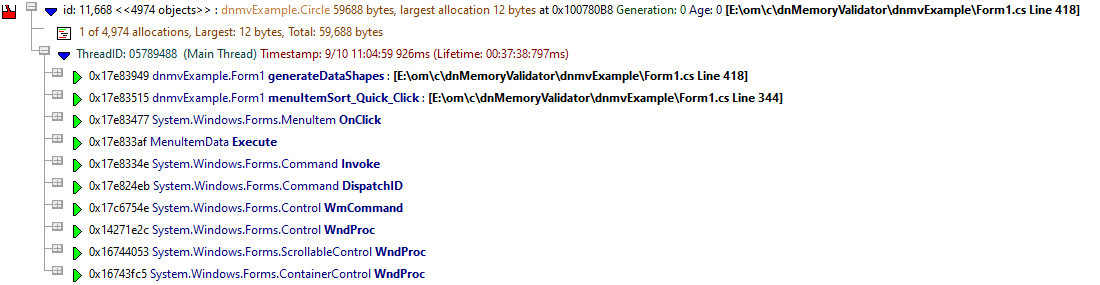
The second callstack representation is that of an object that has been allocated on a callstack that has had objects allocated on it garbage collected.
This colouring is controlled by the Enhanced callstack colouring option on the Callstack settings of the settings dialog.
Display Style
Before displaying the data from a query the data needs to meet the criteria specified by the display style. This is a simple filter based on the availability of source code, and where that source code is on the callstack. The reason for this is that allocations (causing memory leaks) in your source code are fixable, whereas allocations in 3rd party code, or allocations that don't have source code are not fixable because you don't have access to the source code. This doesn't mean you should ignore such allocations as they may be caused by a side effect of one of your allocations or a reference from an object you control, but the ability to filter the data this way can greatly simplify the scope of the query results you are examining and lead to greater insight.
In addition to the display style, data is also displayed according to a callstack group critieria: display all callstacks, or group similar callstacks together.
Both of these styles can be edited using the .Net Leak Analysis display settings dialog.
•Display...  displays the .Net Leak Analysis display settings dialog
Defining a Query
A query is defined by five criteria which need to be matched to put each object into the query results.

To use a criteria in a query enable the appropriate check box.
Object count
•Increasing object count increases each generation
•Increasing or stable object count increases or remains stable each generation
•Decreasing object count decreases each generation
•Decreasing or stable object count decreases or remains stable each generation
Object churn
•No Churn There is no object churn
•N Object has no object churn for N generations
[where N is list of numbers representing each generation except the current generation]
Object generation
•Generation > 0 Any object in a generation greater than 0
•N Object generation is greater than the specified generation
[where N is list of numbers representing each generation except the current generation]
Object age
•Age > 0 Any object older than 0
•N Object age is greater than the specified age
[where N is list of numbers representing each generation except the current generation]
Object activity
•No activity No object activity
•N Object has no activity for N generations
[where N is list of numbers representing each generation except the current generation]
Garbage collected
•Collected callstack Object allocated on a callstack that previous deallocated objects were allocated on
•Not collected callstack Object allocated on a callstack that no deallocated objects were allocated on
•Collected (recent GC) Object of a type that has been collected in a recent GC
•Not collected (recent GC) Object of a type that has not been collected in a recent GC
•Collected (any GC) Object of a type that has been collected in any GC
•Not collected (any GC) Object of a type that has been collected in any GC
Predefined Queries
Setting up queries can be time consuming and tedious. To help with this there are some built-in predefined queries.
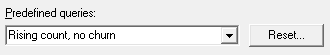
•Predefined queries select a query to use. The controls that define a query will be updated to match the selected query definition.
The default predefined queries are:
oRising count, no churn
oRising count, no churn, previous allocations collected on same callstack
oRising count, no churn, previous allocations not collected on same callstack
oRising or stable count, no activity
oRising or stable count, no activity, previous allocations collected on same callstack
oRising or stable count, no activity, previous allocations not collected on same callstack
oNo churn for 1 generation and no activity for 1 generation
oNo churn for 2 generations and no activity for 2 generations
oNo churn for 3 generations and no activity for 3 generations
oNo activity for 3 generations
oShow objects collected by GC
oShow objects collected by any GC
oShow objects not collected by any GC
oShow objects not collected by any GC where object count is increasing
oShow objects not collected by 3 GCs where object count is increasing
oShow objects not collected by any GC where no object activity
oShow objects not collected by 3 GCs where no object activity
•Add query a new query is formed using the selection in the six combo boxes described in the Defining a Query section. The query is added to the list of predefined queries.
•Reset reset the list of predefined queries to the default predefined queries. All custom predefined queries will be lost.
Running Queries
The controls at the top left define how queries are run and managed.
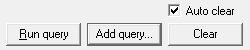
•Run query all objects in the current generation are compared to the current query definition. If they match the query they are displayed according to the display style rules.
•Add query a new query is formed using the selection in the six combo boxes. The query is added to the list of predefined queries.
•Clear all query results are removed
•Auto clear if selected all previous query results will be removed each time a new query is run
Leak Analysis view popup menu
The following popup menu provides options for filtering and examining data in more detail.
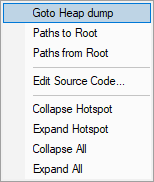
Menu option: Go to Heap Dump, Paths to Root, Paths from Root
The following options are only active for .Net object types. They are disabled for native object types.
•Go to Heap Dump Find the heap dump entries for the selected objects.
•Paths to Root For the selected objects display all the paths from the object to the most recent heap dump roots with the Paths to Root dialog.
•Paths from Root For the selected objects display all the paths most recent heap dump roots to the live objects with the Paths to Root dialog.
Menu option: editing source code
•Edit Source Code... opens the default or preferred editor to edit the source code
Menu options: Collapse Hotspot, Expand Hotspot, Collapse All, Expand All
•Collapse Hotspot or Expand Hotspot simply shows and hides data item information, the same as using the  or
or  buttons
•Collapse All or Expand All collapses or expands all callstack entries