Heap dumps allow you to understand the relationship between each .Net memory/handle allocation in your program.
Heap dumps can be requested manually via the Heap Dump icon or the .Net Tools menu.
Heap dumps can also be requested each time a garbage collection occurs. This is controlled by the settings dialog.
 Click a part of the image below to jump straight to the help for that area.
Heap dump selection
Some simple heap dump management is provided by controls at the top of the Heap dump view.

•Heap Dump  Select the heap dump to display. Click Refresh to the left of the top panel to display the heap dump.
•Clear Heap Dumps Deletes all heap dumps and removes all data from the display
 After clearing heap dumps any attempts to fetch a new heap dump will fail until enough objects have been allocated to allow a garbage collection to run.
•Display... Displays the Heap Dump Settings dialog to control the display of heap dumps
How the display works
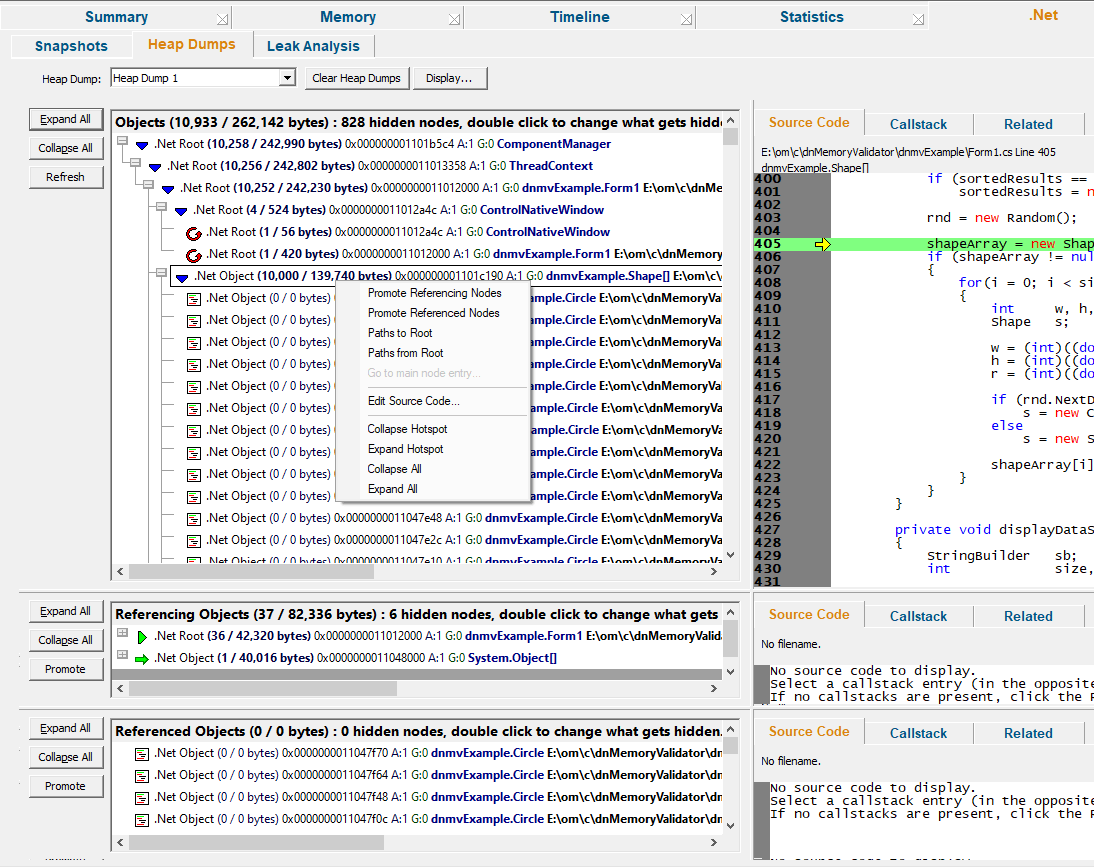
The view is split into two parts horizontally and three parts vertically.
Horizontal
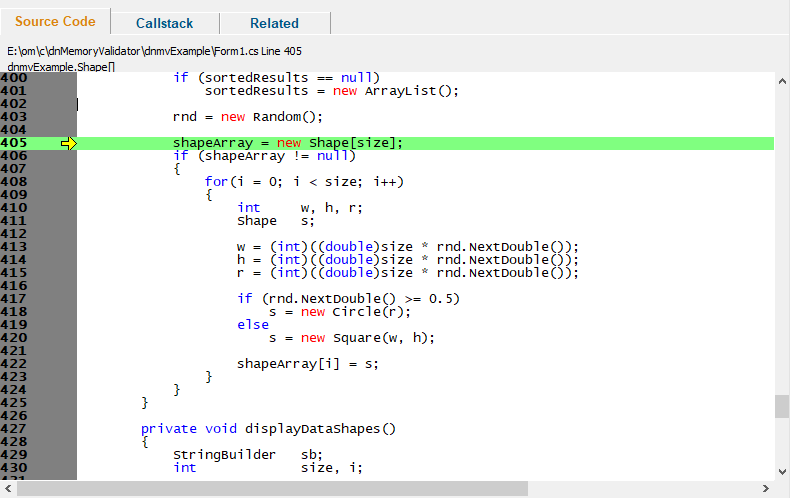
Horizontally the split is between the graph on the left and source code, callstacks and related objects on the right.
Vertical
Vertically the split is between the data we're looking, objects referencing what we're looking at, referencing objects and referenced objects. The referencing objects and referenced objects are only populated when an object is selected in the top heap dump graph. As you change which object is selected the two lower graphs update, and the information displayed to the right also updates - the source code, the allocation callstack and any related objects, these are all updated.
In each vertical section the horizontal split is the same; heap dump graph on the left, source code, callstack, related objects on the right.
How the data relates to each other
Let's take a tour of the user interface by examining each panel. First we need some data to display. We've already performed a heap dump (or a garbage collection has created one for us). Click Refresh to cause the user interface to display the selected heap dump. We start the tour in the top left.
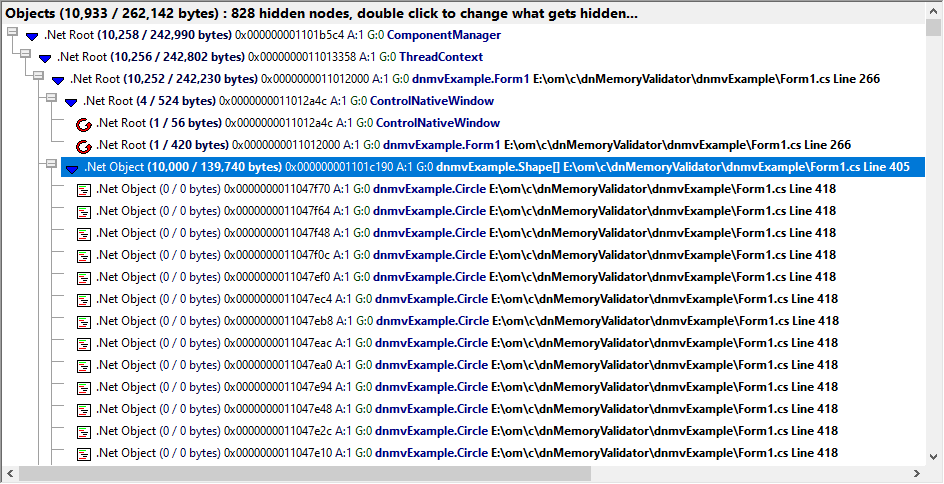
Here we can see various objects, some of which are heap dump roots, and an object with 10,000 referenced objects.
Each object is displayed indicating root, or non-root, how many child objects and their size, object id, age, the generation it was created, it's type and allocation filename and line number. For example:

Non-root
Referencing 10,000 objects of size 139.740 bytes
Object id 0x000000001101c190
Age 1
Generation created: 0
Type shape (in the module dnmvExample)
Filename e:\om\c\dnMemoryValidator\dnmvExample\Form1.cs and line 405
At the left of the panel are three buttons
•Expand All Expands all the graph nodes
•Collapse All Collapses all the graph nodes
•Refresh Displays the selected heap dump. If the heap dump is already displayed it will be redisplayed in it's default state.
In the middle left and bottom left panels we can see the objects referencing the selected object, and the objects referenced by the selected object.
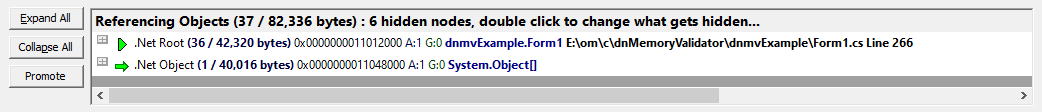
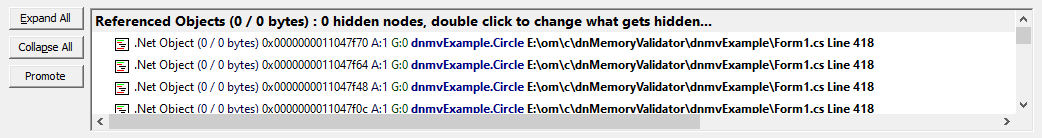
These panels behave in the same way as the top panel, displaying related information on the right. There is one difference - the Refresh button has been replaced by a Promote button.
•Promote Move all nodes (or just the selected node to the top panel) for exploration.
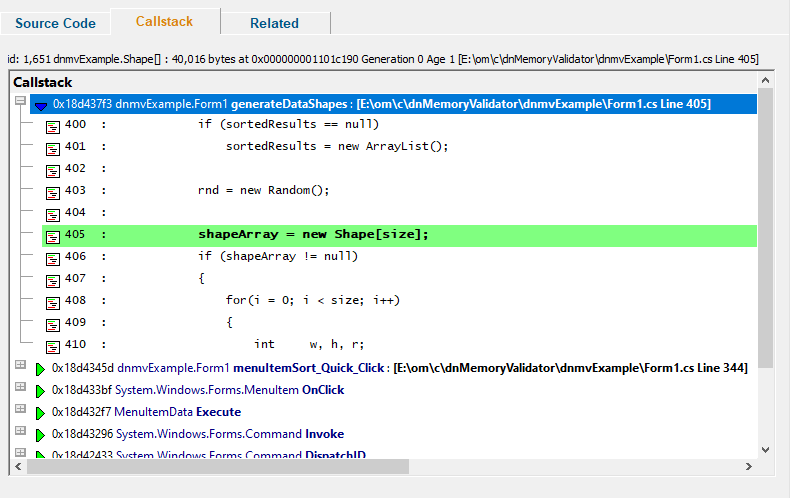
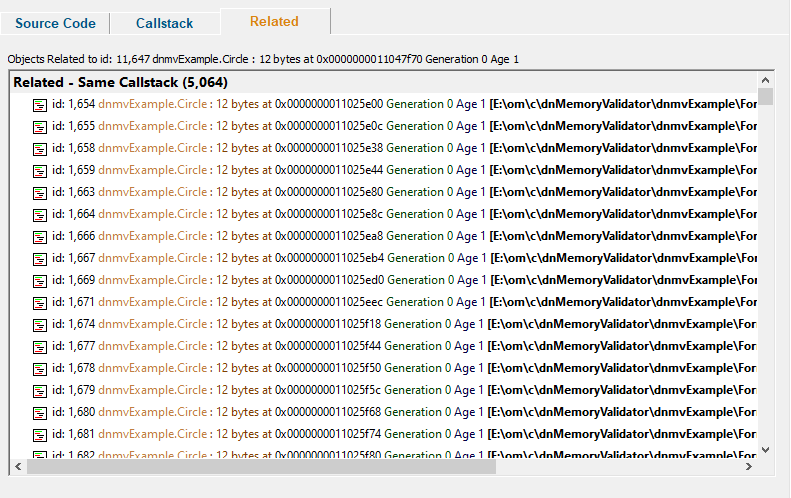
The panels to the right show source code, the allocation callstack and any related nodes (allocated with the same callstack). These panels are duplicated for each of the three panels on the left.
Heap dump recursion
A heap dump is represented as a graph showing which objects have a reference to other objects. Some objects also reference themselves, either directly, or indirectly via intermediate objects, forming a recursive loop.
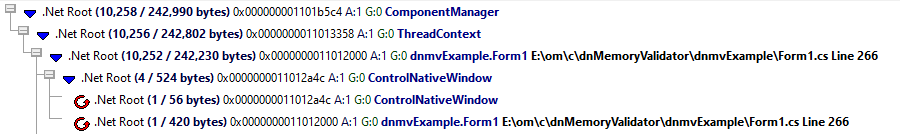
In the above image we can see 0x0000000010352a4c points to itself, and 0x0000000010352000 points to itself indirectly via 0x0000000010352a4c.
Heap dump links
A heap dump has many roots, each with it's own graph of objects beneath it. Because multiple roots may link to the same subgraph we've decided to represent each subgraph only once and show links to that subgraph as an arrow.
![]()
In the above image we can see a link to a subgraph. To visit that subgraph right click on the node to show the context menu then choose Go to main node entry....
Heap dumps view popup menu
The following popup menu provides options for filtering and examining data in more detail.
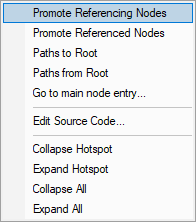
Menu option: Promote, Paths to Root, Paths from Root, Go to main node
The following options are only active for .Net object types. They are disabled for native object types.
•Promote Referencing Nodes Promote the nodes referencing the selected object to the top left panel.
•Promote Referenced Nodes Promote the nodes referenced by the selected object to the top left panel.
•Paths to Root For the selected objects display all the paths from the object to the most recent heap dump roots with the Paths to Root dialog.
•Paths from Root For the selected objects display all the paths most recent heap dump roots to the live objects with the Paths to Root dialog.
•Go to main node entry... Find the heap dump entry for the selected object.
Menu option: editing source code
•Edit Source Code... opens the default or preferred editor to edit the source code
Menu options: Collapse Hotspot, Expand Hotspot, Collapse All, Expand All
•Collapse Hotspot or Expand Hotspot simply shows and hides data item information, the same as using the  or
or  buttons
•Collapse All or Expand All collapses or expands all callstack entries