The Summary tab displays a dashboard showing high level information about the threading behaviour of the current application.
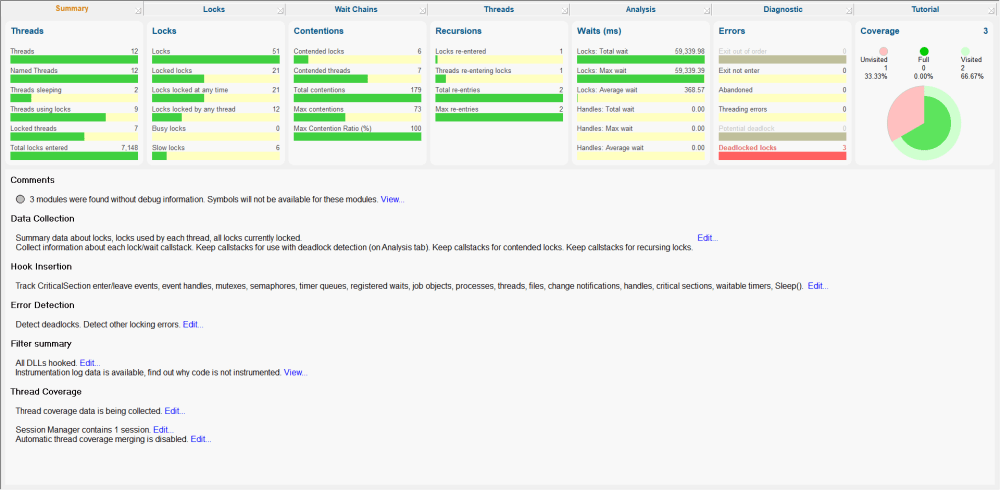
The Summary tab
The summary shows a visual overview with statistics of threads and locks with percentages where appropriate.
Each bar or dial summarises the thread, lock, wait or error information found in the main tabs.
Clicking on a bar or dial takes you to the corresponding main tab to explore in more detail.
Most of the bars take you to the All Locks summary tab, with each one sorting on a specific column related to the data at hand.
Examples:
•Clicking on the Contended locks bar shows the All Locks tab sorted by Contention Count
•The Max Contention Ratio bar shows the same tab sorted by Contention Ratio
•The Recursions Locks re-entered bar shows the All Locks tab sorted by Recursion Count
•The Coverage dial shows the Coverage tab
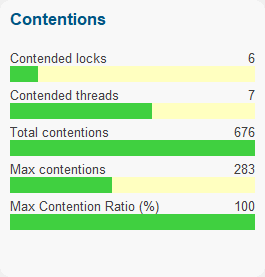
Understanding the bars
Each bar displays the name of the statistic underneath with its value.
Bars are filled to represent the fraction of the value it is related to.
In the example below, the bars show that:
•the number of contended locks is 6, shown as a fraction of the number of locks (in this case 51 which was displayed separately on the Locks panel)
•the number of contended threads is 7, shown as a fraction of the 12 threads being monitored in the application (displayed on the Threads panel)
•the total number of contentions is 676, of which one of the locks is responsible for 283 of those contentions
•the maximum contention ratio is 100%.
Understanding the dial
The Coverage dial displays:
•numeric statistics on visited and unvisited items, and those items with 100% coverage
•the unvisited/visited information as angular data
•the 100% coverage as inner radial data
•the partial coverage distribution as outer radial data
Example:
The following dial summarises thread coverage data on a total of 151 known files in a complex target program
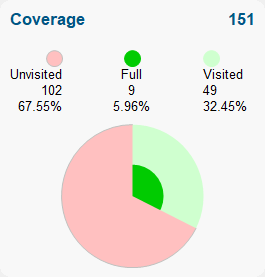
 The radius of the inner area may grow or shrink as the target program runs, since the proportion of visited functions that have 100% coverage can go up or down.
Status summary area
Below the dials is a status area showing any comments or special notices related to the current session.
Underneath the comments you'll find the status of any data collection, error detection, filters, or session merging.
Clicking Edit... or View... opens a dialog to edit or view the relevant settings.
In most cases the settings shown are identical to the relevant page of the global settings dialog.
Comments:
•Debug modules |
View... |

Data Collection:
•Locks and callstacks |
Edit... |
Hook Insertion:
•Locks and handles |
Edit... |
Error Detection:
•Threading errors |
Edit... |
Filter Summary:
•DLLs Hooked |
Edit... |
•Instrumentation logging |
Edit... View... |
Thread Coverage:
•Thread coverage collection |
Edit... |
•Session manager status |
Edit... |
•Session merging status |
Edit... |