Viewing the DLL debug information
If you are having problems collecting thread data for a particular EXE/DLL the problem may be that the debug information that is required to perform the instrumentation of the software cannot be found.
You can view a list of the debug information status of modules loaded by your target application.
 Tools menu
  DLL Debug Information... shows the DLL Debug Information dialog below
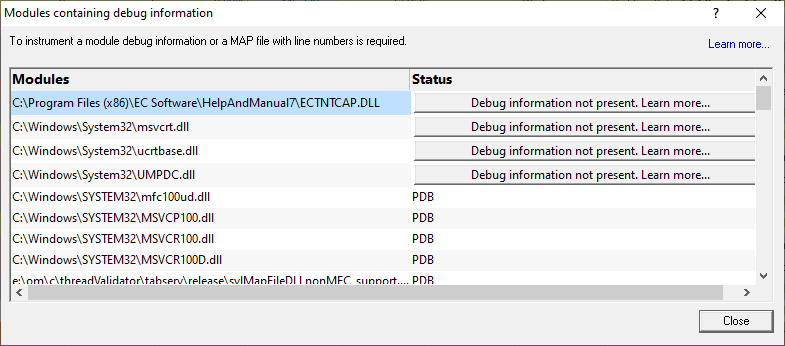
The dialog shows:
•the path from which Modules (DLL or EXE) were loaded
•the debug Status (below)
•if any symbol server is not reachable (offline or doesn't exist) a message will be shown in red at the bottom of the dialog. You can edit the symbol server definitions here.
Debug status
There are various reasons why a module may not have its debug information read.
The dialog shows a comment or reason in the status column. Examples might be:
•PDB or MAP if the debug information was found and used
•Debug information not present
•A reason for being ignored
•Module is a part of the C Run-time Library (CRT) or Standard Template Library (STL)
•Location is a system directory
•Ignored due to Hooked DLLs advanced settings
•File is a Software Verify own module
•Module has been specified as a 3rd party
•No executable code is contained
•The module only has GUI resources
More information about PDB and MAP files
Clicking on the Learn more... link at the top right of the dialog shows some more details with additional links to topics in this help.
 Click the links below to read more in our frequently asked questions.
Finding out more using the Debugging Information Diagnosis Dialog
When debug information is not present for a given module the DLL Debug Information dialog (above) may display a button in the Status column to show the Debugging Information Diagnosis dialog.
The dialog shows:
•Information, advice, and diagnostic help
•Quick links to change settings
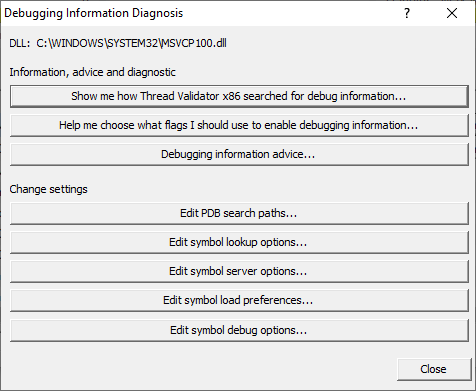
The information options include:
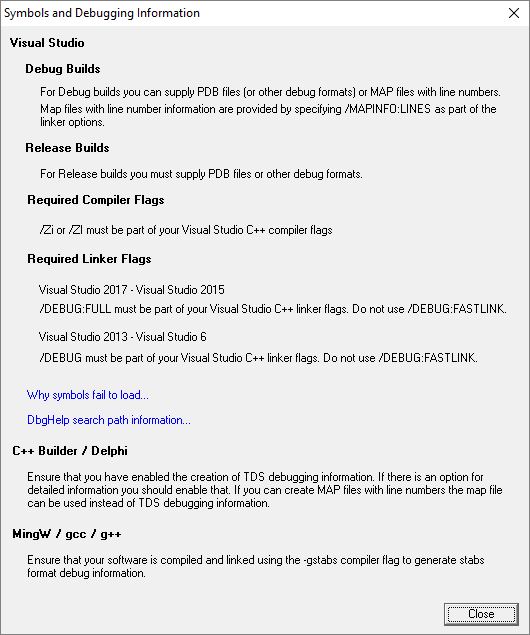
•Debugging information advice... shows the Symbols and Debugging Information dialog above.
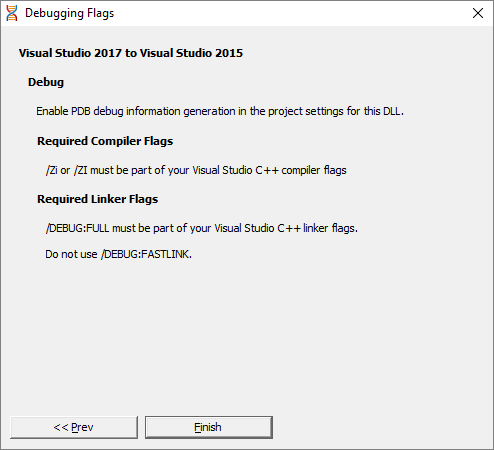
•Help me choose what flags... shows the Debugging Flags wizard
Use the wizard to first select the compiler or linker you're using
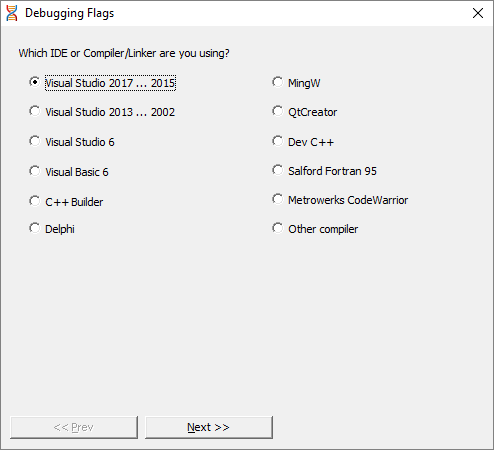
Next >> Provides the relevant debug compiler and linker flags. An example for Visual Studio 2017 to 2015 is below:
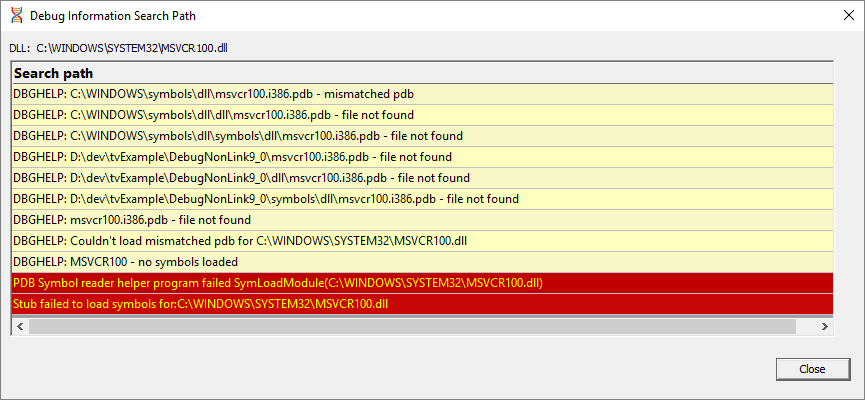
•Show me how debug information was searched for... shows the Debug Information Search Path dialog
This information is extracted from the Diagnostic tab and shows only the relevant information for the module selected in the DLL Debug Information dialog.
The options for changing settings include quick links to the following pages from the Global Settings Dialog
•Edit PDB search paths... shows the File Location settings page for PDB files.
•Edit symbol lookup options... shows the Symbol Lookup settings page
•Edit symbol server options... shows the Symbol Servers settings page
•Edit symbol load preferences... shows the Symbol Load Preferences settings page
•Edit symbol debug options... shows the Symbol Misc settings page