The Threads tab lets you monitor the history of lock states in each thread in relation to other threads.
 Read on, or click a part of the image below to jump straight to the help for that area.
The Thread History View
The view is split vertically into two halves.
The top half monitors a history of lock activity in known threads on a horizontal time-line using sampled snapshots of the thread states.
The state of each thread is displayed as a coloured block, as defined by the lock colour settings.
For example, below is a sequence of 28 samples of three threads taking part in a good locking strategy which starts after the fifth sample.

Newest samples appear on the right of the display.
Selecting any one of the blocks displays the thread and critical section information in the Locks and Lock Order tabs in the lower half of the view.
When selecting a block, any cells that are related by critical section address or waited Win32 handle are also highlighted.
The interval at which thread states are sampled can be changed (see Update Interval in the next section).
The sampled data is stored in a buffer, the size of which can be specified, but which defaults to 1000 points.
The display can be zoomed from one cell per data item to displaying the entire data buffer on the screen.
Managing the time-line data
The options above the time-line graph (initially blank) let you controlling the recording and display of the sampled data.
•Start / Stop  control the recording of the sampled thread states
•Clear remove all samples from the display and from the sample buffer
You don't have to stop recording before clearing the data
•Update Interval automatically updates the display at your choice of interval, from 0.1 to 60 seconds
This should be set depending on the complexity of your application.
 An update interval that is too short may mean Thread Validator spends too much time updating the display.
Display settings
The Thread History Settings dialog controls a small number of recording and display options.
•Display... show the Thread History Settings dialog:
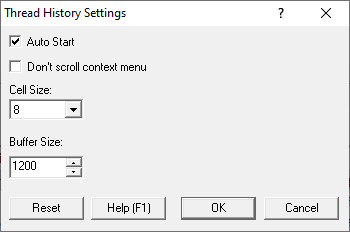
•Auto Start automatically start recording thread samples when you launch an application
•Don't scroll context menu prevent the time-line from updating while its popup menu is open
Data samples are still recorded and are displayed when the menu is closed.
•Cell Size choose the size of each cell displayed on the display
The name or id of the thread on the left hand side are also affected.
•Buffer Size set the number of samples to keep track of in the time-line (default is 1000)
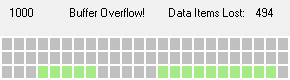
The buffer operates on a first-in first-out basis, so when the buffer is full, oldest samples are discarded in favour of new ones.
When the buffer is full an overflow warning and a count of lost samples is displayed as below:
•Reset reset the above values to their defaults
Thread history menu options
Most of the menu options the same information and callstack options as on the Locks Per Thread tab and several others.
In this thread history view, the menu options apply to the selected sample block in the time-line display.
Three additional options are available, to highlight related blocks within the samples displayed.
•Highlight locked critical sections highlight other blocks that locked critical sections or waits used in the selected block
•Highlight contended critical sections highlight other blocks that contended critical sections or waits
•Highlight locked and contended... highlight other blocks that locked or contended critical sections or waits
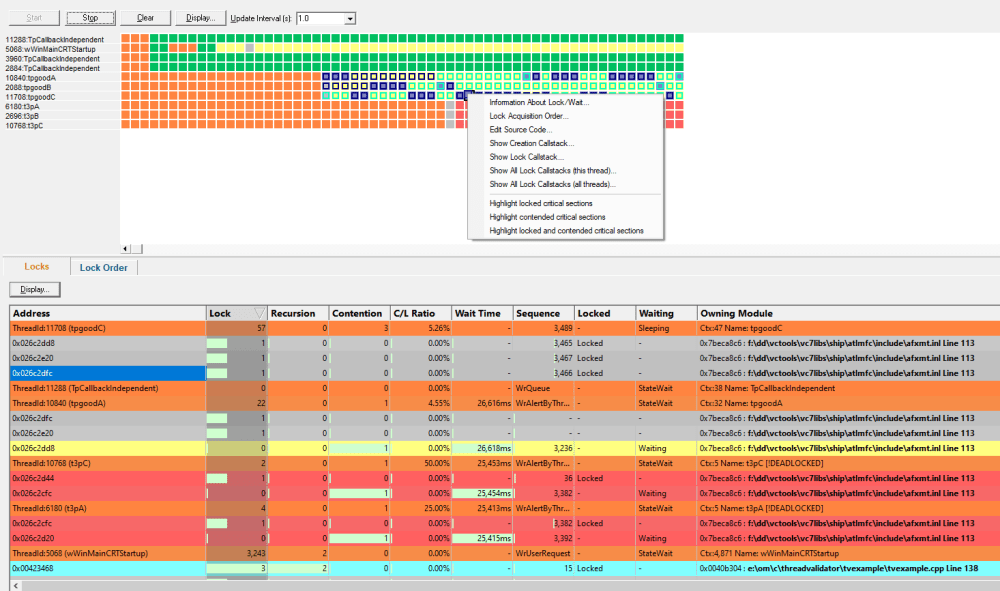
The Locks tab
The Locks tab in the bottom half of the view shows information about locked or waiting critical sections for each known thread in the target application.
Only the lock information at the selected sample point in the top graph is displayed. Selecting blocks at different points along the time-line will change the data shown.
The set of displayed information is the same as the Active Locks, except that here only locks active at the selected sample point are listed.
Thread rows will be highlighted in the thread information colour (orange  by default) or pale red
  , the stalled thread colour unless you customise these colours.
Each relevant critical section is shown once underneath each thread and the display can be sorted by different criteria by clicking on the appropriate column header.
The table highlights error and status conditions using the user defined lock colours. In the example above, yellow  indicates a contention, and cyan
  for recursion.
Lines highlighted in grey  denote an active status, meaning that the critical section has been entered.
Unlike the All Locks tab, critical sections where nothing of interest has happened are not displayed.
Any WaitForXXXObject calls used by each thread in the application are also listed.
What data is available in the Locks tab?
The columns displayed in the Lock tab view are identical to the columns on the Locks Per Thread tab (and the Active Locks tab).
Note that like the Locks Per Thread, the thread header rows display different information to the critical section rows.
Locks tab menu options
The menu options are also the same as those on the Locks Per Thread tab.
Locks tab display settings
The thread history display settings are the same as the Locks Per Thread tab display settings.
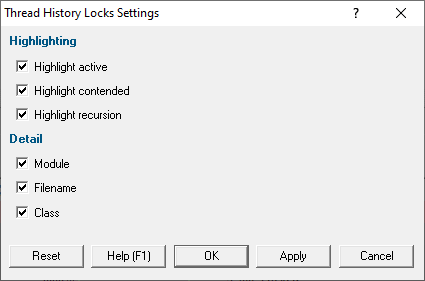
•Display... shows the Thread History Locks Settings dialog:
Highlighting related time-line data from the Locks tab
Selecting rows in the Locks tab of the lower view highlights related data in the sampled time-line view.
Selecting a row for a...
•Thread highlights blocks if they use critical sections and Win32 handles used in the selected thread
•Critical section highlights blocks if they use critical sections with the same address
•Single or multiple wait highlights blocks if they use Win32 handles with the same handle value(s)
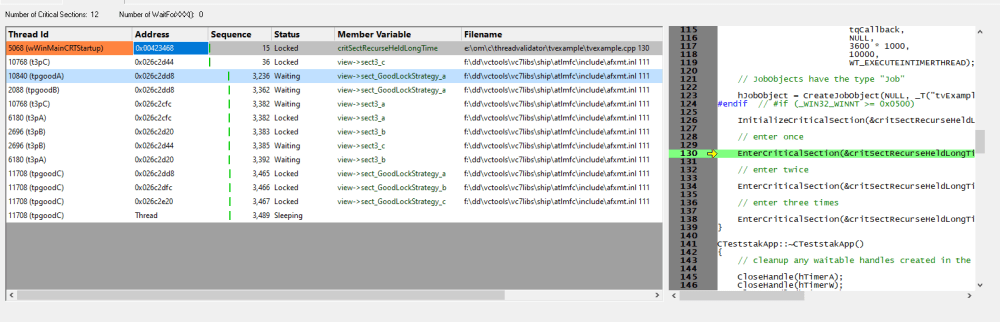
The Lock Order tab
The Lock Order tab in the bottom half of the view shows locks and waits in the sample in sequence number order.
The dialog displays the order...
•in which critical sections are locked and waited upon
•that waits are entered into
•in which threads sleep and are suspended
The data and menu options are very similar to the Locks and Waits in Sequence Order dialog, except that here the entries shown are those at the selected sample point in the time-line.
Selecting an entry (lock, wait or thread) will highlight the other locks, waits and threads that are related. For example selecting a lock will highlight all locks entries that have the same address, regardless of the thread they are used in. Also any other entries related to the same thread are also highlighted. This allows you to see where you hold locks and where the same lock is waiting. The source code showing where the lock is locked or waiting is shown on the right of the display.