The .Net Memory Tab Display Settings control the .Net memory, .Net handles and displayed on the .Net Memory tab.
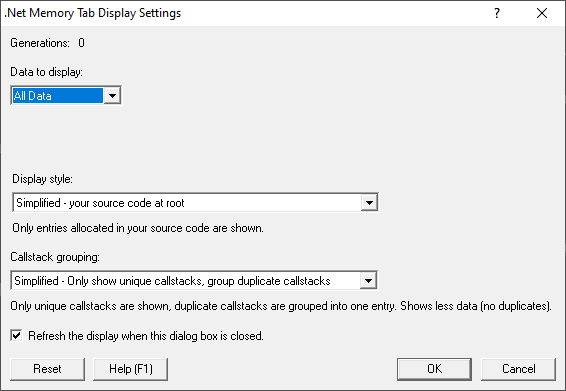
The default options are shown below:
 Note that these settings control what is displayed, not what is collected. The .Net data collection settings may have more information about some of the settings below.
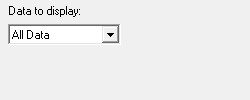
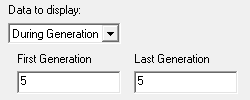
The Data to display combo causes the dialog to update as it is changed. The combo has four values
•All Data  display all information (unless filtered)
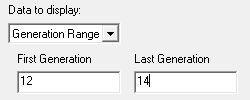
•Generation Range displays information about every allocation between two generations (unless filtered)
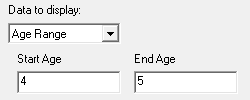
•Age Range displays information about every allocation between in the specified age range (unless filtered)
•During Generation displays information about every allocation that was alive during generation (unless filtered)
Other settings
Setting |
Displays... |
•Group by Callstack |
display all callstacks or just unique callstacks |
•Refresh the display when this dialog box is closed |
updates when this settings dialog is closed |
The display style can be one of the following values:
•Full information about every allocation and error is displayed (unless filtered)
•Simplified - your source code at root Only traces that have a callstack with your source code at the top of the callstack are displayed
•Simplified - your source code not at root Only traces that have a callstack with your source code in the callstack (except for the top position) are displayed
•Simplified - your source code anywhere Only traces that have a callstack with your source code anywhere in the callstack are displayed
•Simplified - compiler vendor source code at root Only traces that have a callstack with your compiler vendor source code at the top of the callstack are displayed
•Simplified - compiler vendor source code not at root Only traces that have a callstack with your compiler vendor source code in the callstack (except for the top position) are displayed
•Simplified - compiler vendor source code anywhere Only traces that have a callstack with your compiler vendor source code anywhere in the callstack are displayed
•Simplified - no source code Only traces that have a callstack with no source code are displayed
The callstack grouping can be one of the following values:
•Full every callstack is shown
•Simplified - Only show unique callstacks Traces that share the same callstack are displayed once. A summary is shown indicating the number of allocations, how many bytes in those allocations and the size of the largest allocation.
Reset
•Reset resets all the display related settings for this tab