The Pages tab displays all known memory allocations according to the virtual memory page in which they were allocated.
If the Pages tab isn't visible, use the Data Views menu to set which views are shown.
 Click a part of the image below to jump straight to the help for that area.
This tab provides a snapshot of how the memory in use is distributed across virtual memory pages (4K in size).
By looking at the data, especially the graphical view, you can see the memory fragmentation, and find out which parts of the application are using each memory page.
The Pages Data
The data lists all virtual memory pages used by the target application, omitting those pages that have no allocations within or overlapping them.
The first line of data gives an overall summary, for example:

The remaining expandable items are shown in page order:

Each page item shows:
•the page address
•the number of allocated objects completely or partially in the page
•the percentage fragmentation within the page
•number of bytes used
•unused bytes
Expanding an item shows details about allocated objects and free space in each page.
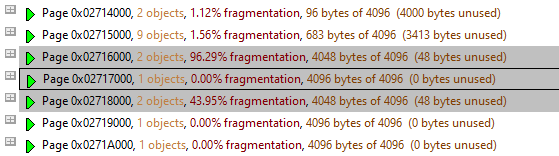
Selecting one page in the list may highlight others either side in gray as below. This indicates that those pages are linked by memory allocations spanning between or across those pages.
Display options allow you to focus either on the objects within each page or on the order of the objects and free space.
 Note that unlike many of the other data tabs, the pages data is not automatically updated at regular intervals. You'll have to click Refresh to get an update.
At the far left of the window are some options for updating and viewing the data.
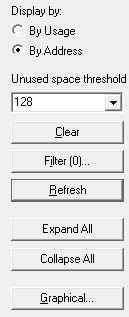
Display settings
The display option at the top changes how the data is displayed when you expand each page data item:
•Display by Usage  orders the information within each page by the objects using it, and then by the chunks of free space, grouped by size
•Display by Address shows each page's information by the start address of each object or chunks of free space within that page
•Unused space threshold when displaying by address, free space blocks greater than this threshold are highlighted as below
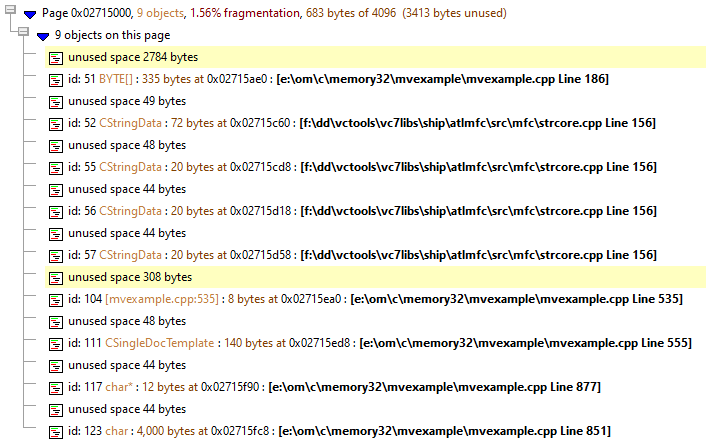
Each allocated object in the expanded view shows data type, size, address, and source file with line number if known.
Below are examples of a page's details expanded for each display method:
By usage:
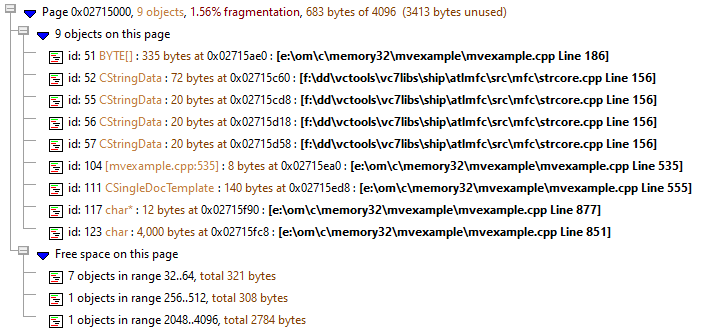
By address, highlighting free space blocks over the set threshold:
Updating the display
•Clear removes all data from the display
This can be useful if you have limited RAM and inspecting large applications as it frees up resources used by Memory Validator so that you can use another tab view.
•Refresh updates the display - as does the  button on the Tools menu and toolbar
•Expand All expand all entries on the display
•Collapse All collapse all entries on the display
Graphical view
•Graphical shows the following dialog visualizing the page data in memory
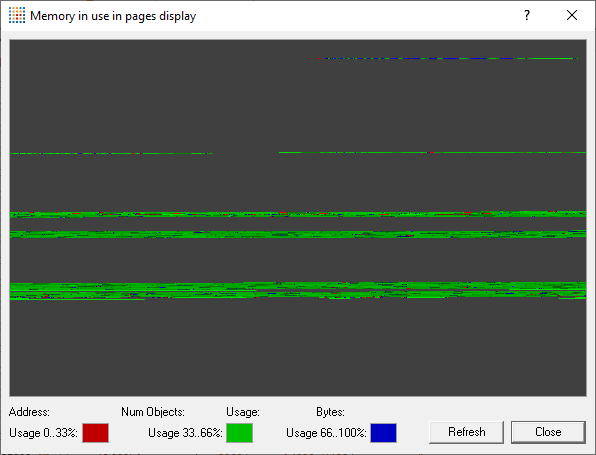
This view uses a single coloured pixel for each page of memory, wrapping from left to right and top to bottom:
•Red very fragmented - 0 to 33% usage
•Blue fragmented - 33 to 66% usage
•Green least fragmented - 66 to 100% usage
Hovering the mouse over any coloured area in the graph shows the address, number of objects, and the usage as a percentage and number of bytes just below the graph.
The graph has a popup menu giving access to allocations, reallocations and deallocations as follows:
•Page information... allocations in the selected page (pixel)
•Region information... allocations in the same contiguous block of colour (i.e. with the same fragmentation level)
An example of the page information dialog is below. The region information shows the first and last page address accordingly.
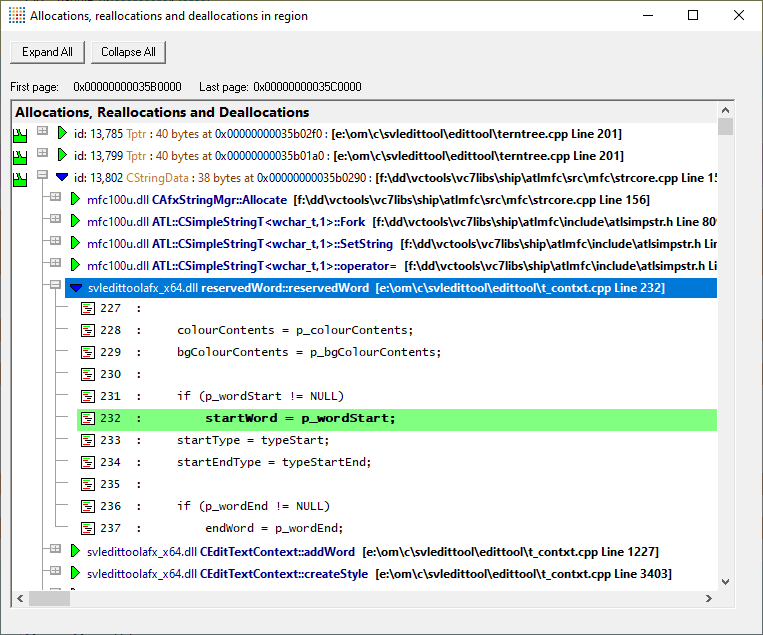
The allocations in the dialog can be expanded, to show the local source code, and double clicking launches your preferred editor with the source file.
Local filters and settings
•Filter... shows the local filters dialog for the Pages tab
The filter button also indicates the number of local filters, although not all of these may be enabled

Searching for memory in pages
You can search for items in the displayed data using the  button in the toolbar, and the Search option in the Query menu.
Totals
At the bottom of the options on the left are two totals:
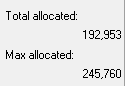
•Total allocated gives the total memory consumption for all allocated objects
•Max allocated shows the total allocation capacity for all the virtual memory pages currently in use
This would simply be the number of pages multiplied by 4K, so in the example above 57 pages * 4096 = a capacity of 233,472 bytes
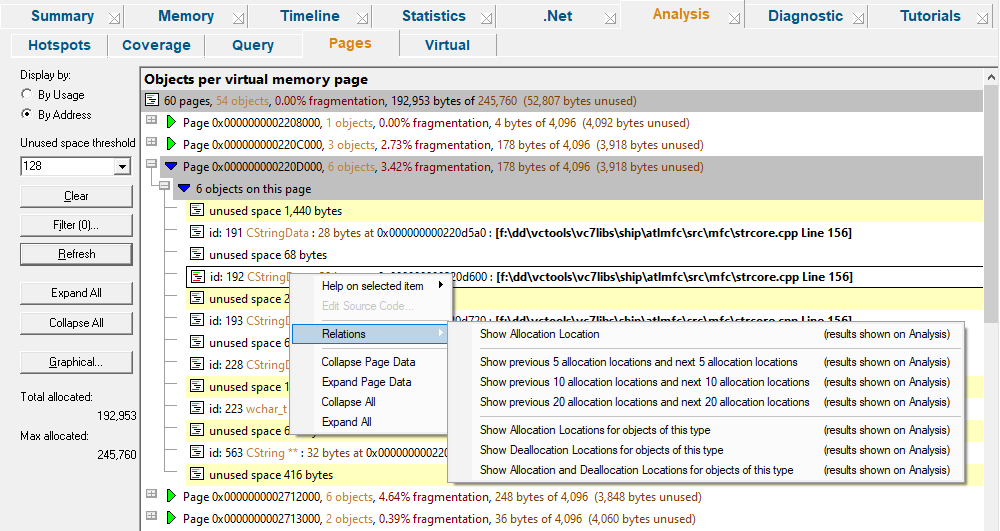
Pages view popup menu
The following popup menu is available over the data area
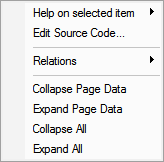
Menu option: Help on selected item
•Help on selected item the sub-menu shows a simple one line description of the type of data that has been selected:
Menu option: editing source code
•Edit Source Code... opens the default or preferred editor to edit the source code
Menu option: relations
When used over an allocation within a page, the relations sub menu lets you show some related allocations in the Analysis tab to inspect in more detail.
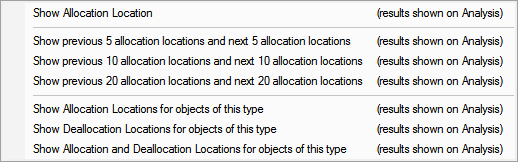
•Show Allocation Location adds only the allocation for the selected item in the page to the Analysis tab
•Show previous and next... adds the available allocations for the allocations in the specified event sequence range, relative to the selected item in the page
For example, choosing the previous and next 10 allocations, shows allocations in the range id-10 to id+10, but only those that are still accessible.
•Show Allocations/Deallocations for type adds all the allocations/deallocations (or both) to the Analysis tab that match the object type of the selected item in the page
For example, if the allocation in the page is of type BYTE[], this will show every allocation that is of the same type, including the one you selected.
Menu options: collapse / expand page data
•Collapse or Expand Page Data simply shows and hides the information for the selected page, the same as using the  or
or  buttons
•Collapse or Expand All completely collapses or expands all the pages information in the display