C# and C++ profiler - Performance Validator 7.79
Struggling to find the performance bottlenecks for your software written in multiple languages?
Do you want to view a real-time call stack as your application executes?
Do you want to automate your performance profiling?
Do you want to post your profiling results on your company intranet in HTML or XML?
If that sounds like you, we’ve got a software profiling tool for you.
4 Minute Video
Performance profiling with Performance Validator.
Performance Validator is a performance profiler for use by software developers and software quality assurance testers using .Net, .Net Core (C#, VB.Net, etc) and native language compilers (C, C++, Delphi, VB6, Fortran etc.).
Use Performance Validator to:
- Identify slow (time-consuming) functions in your application.
- Identify busy (called very often, not necessarily slow) functions in your application.
- View application behaviour in real-time.
- Improve your software quality testing with interactive profiling displays.
- Create profiling reports with collapsible call trees and call graphs to share with your team on your intranet.
- Automatically profile your software using the command line API. (For use with Jenkins, etc.).
- Improve your unit tests, smoke tests and regression tests by automatically adding profiling support to the tests.
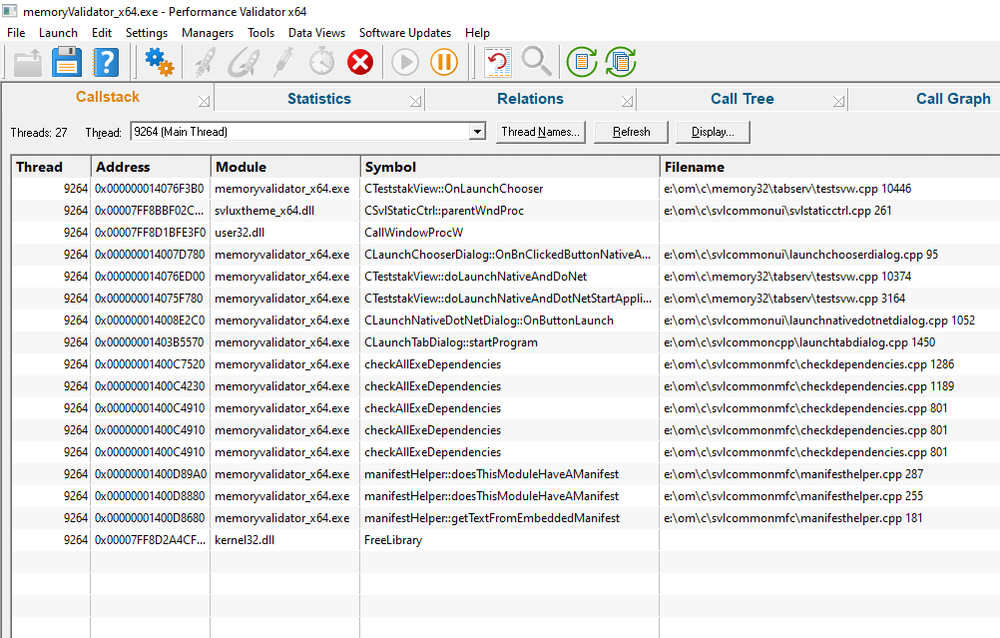
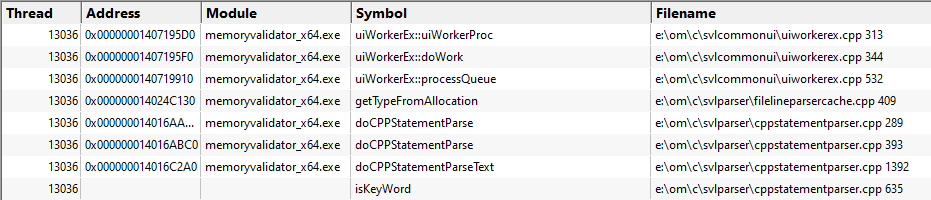
Real-time Callstack
The call stack view displays the current call stack for the selected thread.
This view is useful for getting a quick insight into where the application is currently executing.
Threads can be named by the program under test using SetThreadDescription(), the thread name exception, or named explicitly using the user interface.
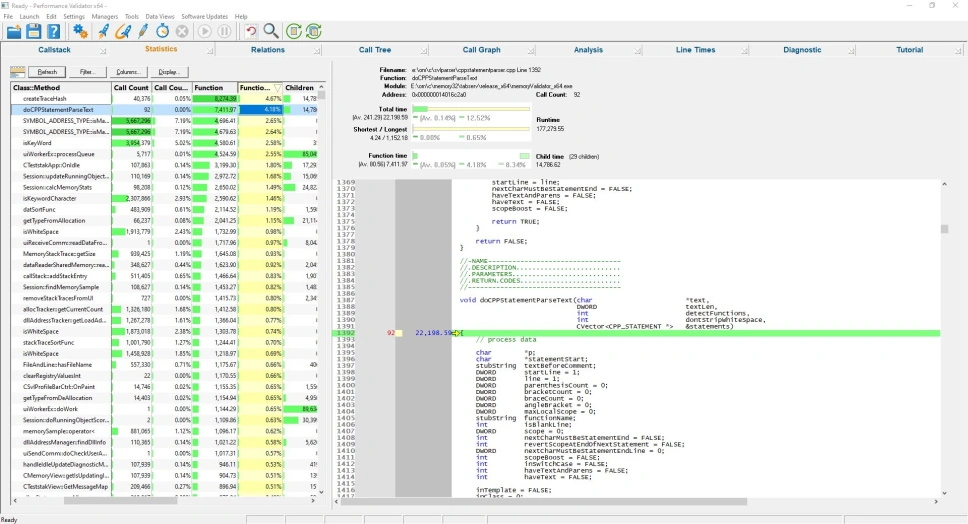
Statistics
The Statistics view displays performance data for all functions that have been executed.
You can sort the data by any of the displayed criteria, allowing you to find the busiest functions, the slowest functions, and the functions taking all the time, etc.
When a function is selected in the left-hand pane, the source code for that function is displayed in the right-hand pane, with related statistics for the performance node displayed above the source code.
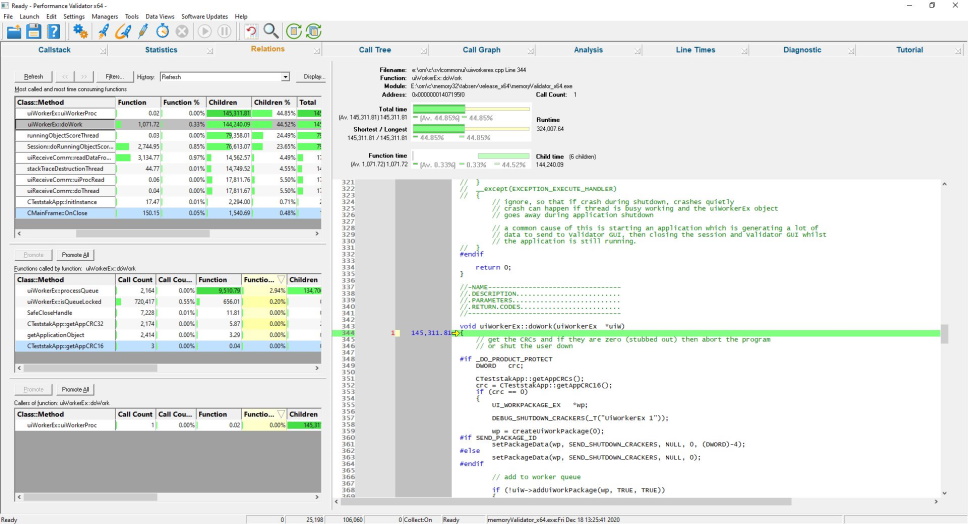
Relations
The relations view allows you to explore the relationship between a function, the functions that call it, and the functions that it calls.
When a function is selected in one of the left-hand panes, the source code for that function is displayed in the right-hand pane, with related statistics for the performance node displayed above the source code. In addition, the relations panes for the callers and callees of the functions are also populated, allowing you to see which functions call which other functions.
A Back button allows you to retrace your steps when analysing the data.
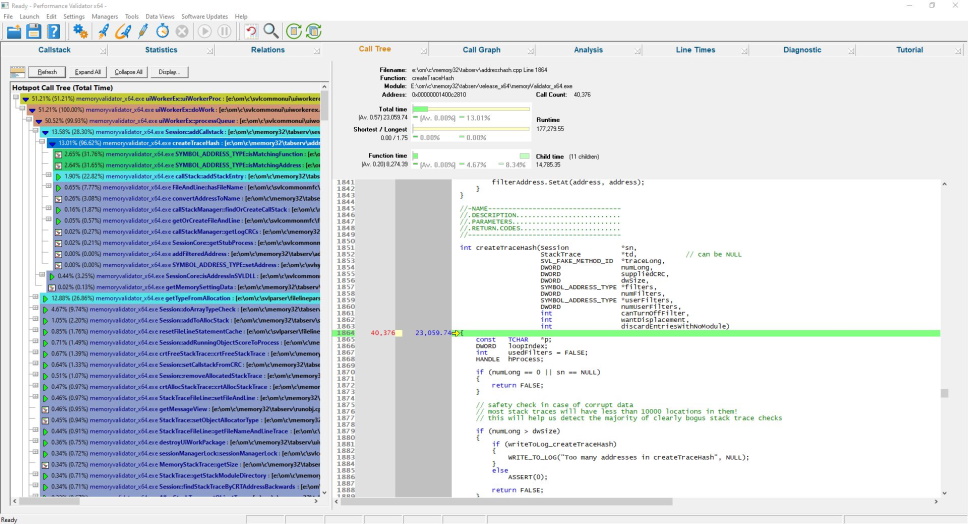
Call Tree
The Call Tree view displays a collapsible performance call tree calculated from the profiling data.
The call tree can be filtered to remove nodes that contribute less than a specified threshold value, allowing you to ignore functions that contribute little profiling time.
The colour coding allows at-a-glance viewing of the performance contribution of each function in the performance call tree.
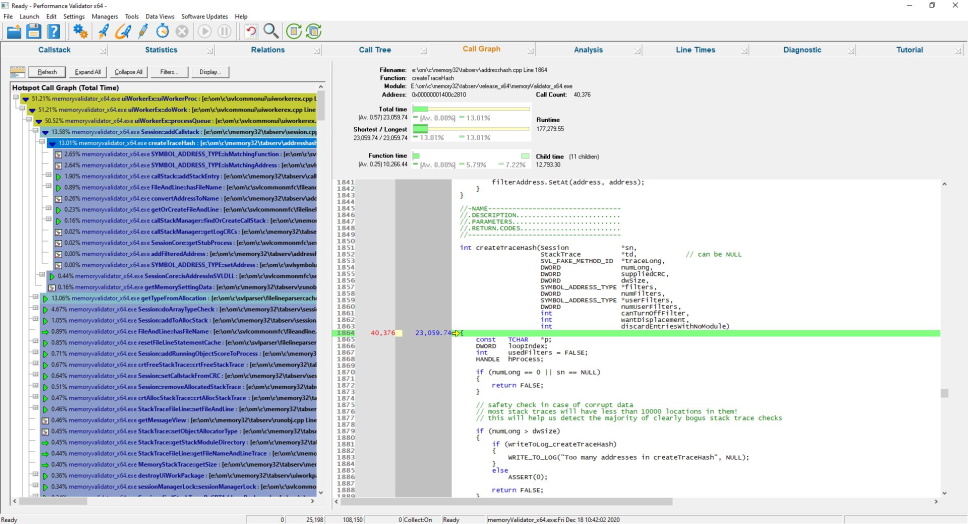
Call Graph
The Call Graph view displays a collapsible performance call graph calculated from the profiling data.
This view is similar to the Call Tree, except that the Call Graph is the minimal set of all functions shown in the Call Tree.
The call graph can be filtered to remove nodes that contribute less than a specified threshold value, allowing you to ignore functions that contribute little profiling time.
The colour coding allows at-a-glance viewing of the performance contribution of each function in the performance call graph.
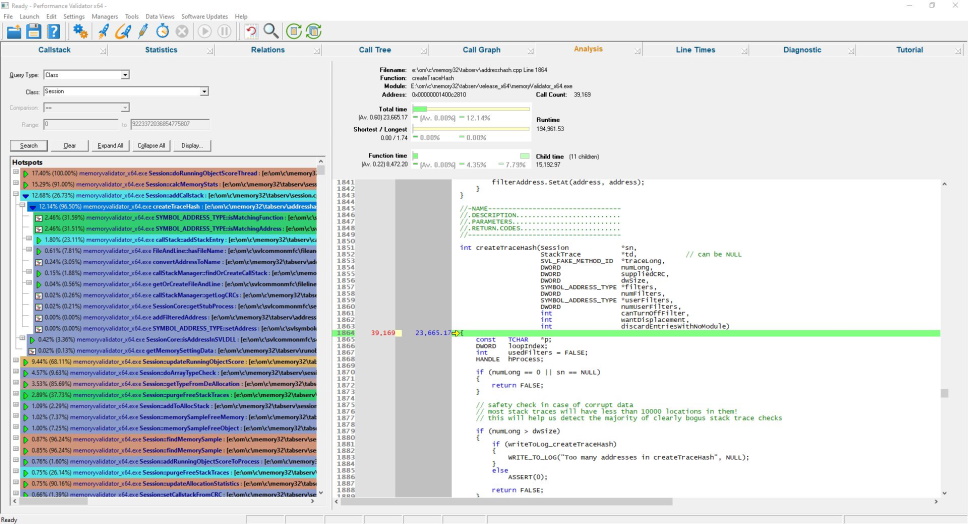
Analysis
Sometimes the best way to dig into a problem is to run queries on the data rather than look at the various data displays. That’s what the Analysis view is for. The Analysis view allows you to slice and dice the profiling data using various queries.
The results of each query can be restricted to a small subset of the results if required, allowing “show 10 most timing consuming functions” type of query.
The results are shown as a colour-coded performance hotspot graph that can be expanded and collapsed as desired.
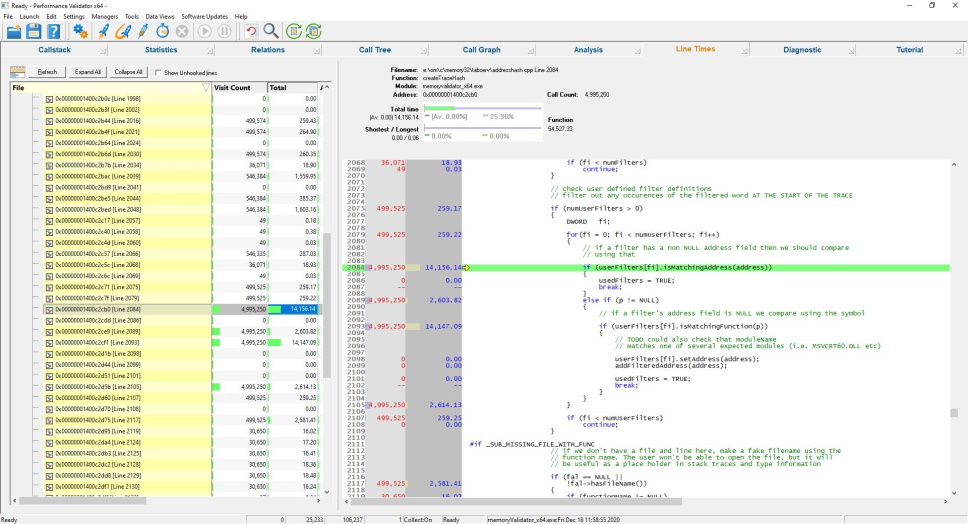
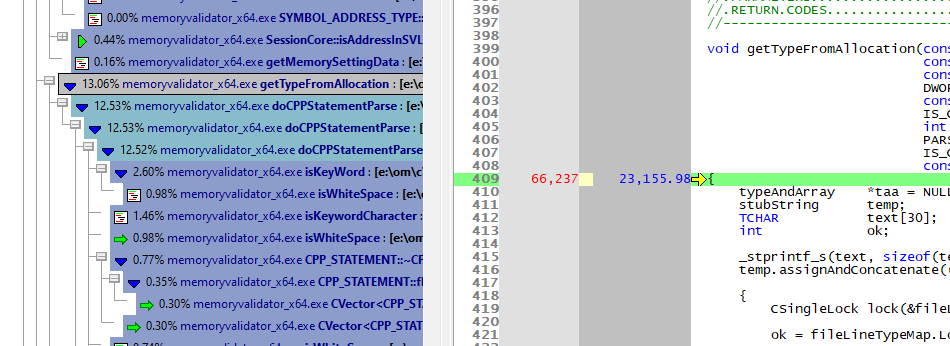
Line Timing
The line times view displays line timing statistics for each line in each source file of the application.
Line timing is best applied to one function at a time – using the Line Timing Filters.
The best workflow is to identify a function using function profiling, and then select that function for line timing to work out which parts of that function are slow.
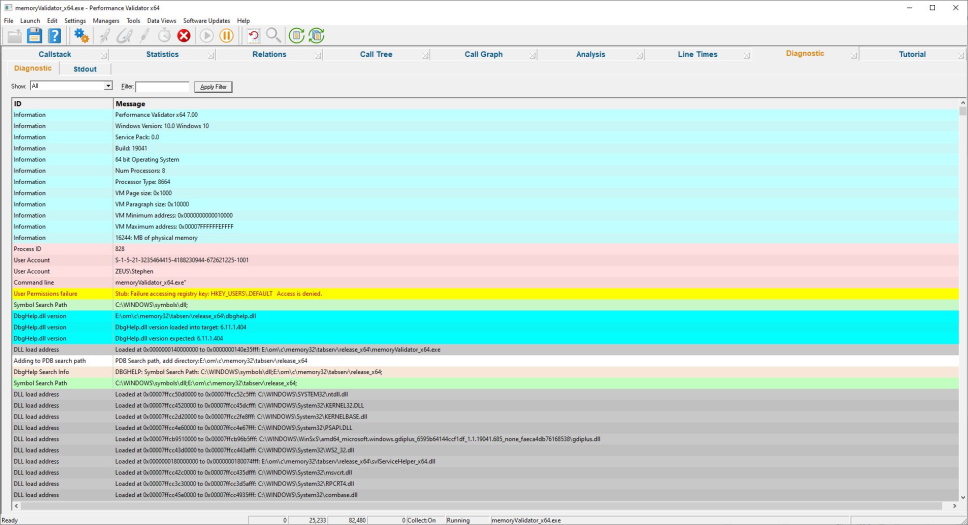
Diagnostics
The diagnostic view informs you of any information that you need to know which may affect the performance of Performance Validator.
- DLL load address
- Symbol information search/load/success/failure
- Instrumentation success and failure
- Disassembly of troublesome code
- Misc diagnostic info
- Env vars
- Stdout/Stderr
Get to work in minutes
You don’t need to modify your application, recompile your software or relink your application.
Just launch your application from Performance Validator and start profiling your software immediately.
Performance Validator uses your software’s debug information to perform the instrumentation of your software. Supported debug formats are PDB, TDS, DWARF, STABS and COFF. We can also use MAP files if line number information is present.
Working with a service or IIS/ISAPI?
You don’t need to modify your software unless you are writing a service or working with IIS.
If you’re working with a service or IIS, there is a simple API you can use that you can “fit and forget”. It’s so easy to use you can leave the API linked into your release product – it will do nothing unless Performance Validator is present.
4 step performance profiling
This simple 4-step process is how you profile your software.
- Launch your application with Performance Validator.
- Run your application as normal.
- Close your application.
- Examine the profiling statistics that Performance Validator generates as your application runs.
Intuitive data displays show you the performance statistics as your application executes. You do not need to wait until your application has finished to view statistics for any function, file or DLL. The displays can be filtered to show you only the information that you want to work with.
Detailed, colour coded source code shows at-a-glance which functions and lines have executed and how long each took.
Configurable
Performance Validator can be configured to collect all data or just the data you need. Powerful filters for collecting data and for displaying collected data give you maximum flexibility and control over how much CPU time is spent and how much memory is used collecting data allowing you to choose how much effort is put into a given task.
API
Performance Validator provides an API for using Performance Validator with services for the case when Performance Validator cannot inject into a service because of Windows NT security privileges preventing the injection (typically for services running at Administrator or system level).
Filtering
The default options of Performance Validator provide profiling data for all DLLs and files in your application that have debugging information. If you wish to only create profiling reports for selected DLLs, or exclude certain file types or even specific classes and methods, Performance Validator has filtering capabilities to allow such customisation.
Exporting profiling data
Performance Validator provides powerful HTML and XML reporting capabilities, allowing you to produce profiling reports that you can share with your colleagues or post on your company intranet. The HTML reports can include animated collapsible call trees and call graphs.
Compatible
Performance Validator works with compilers from:
| Vendor | Language | Compiler / IDE |
|---|---|---|
| Microsoft | C++, C, Visual Basic 6, C#, VB.Net, J#, F#, .Net, .Net Core | Visual Studio, Visual Studio Community Edition, Visual Studio Express |
| Intel | C++, C, Fortran | Intel Performance Compiler, Intel Fortran |
| Embarcadero | C++, C, Delphi | C++ Builder, Delphi, Rad Studio |
| MinGW | C++, C | g++ / gcc |
| Cygwin | C++, C | g++/ gcc |
| MSYS2 | C++, C | g++/ gcc |
| LLVM | C++, C | Clang |
| Qt | C++, C | QtCreator |
| Metrowerks | C++, C | Code Warrior |
| Salford Software | Fortran 95 | Fortran 95 |
We support many versions of Visual Studio: Visual Studio 2026, 2022, 2019, 2017, 2015, 2013, 2012, 2010, 2008, 2005, 2003, 2002 and Visual Studio 6 are supported. We also support Visual Studio Community Edition and Visual Studio Express.
All 64 bit (x64) Windows operating systems are supported.
All 32 bit Windows operating systems from Windows 11 to Windows XP are supported.
.Net and .Net Core
If you’re using .Net and/or .Net Core, Performance Validator supports these technologies. All .Net versions are supported. All .Net Core versions are supported.
If you’re also using native code with your .Net applications, we’ve also got that covered, mixed mode applications are supported.
Applications, services, web servers
Performance Validator works with applications, services and IIS/Web Development Server, both native and mixed-mode .Net.
Regression test support
As well as the traditional performance profiling role that Performance Validator performs, Performance Validator can be used for interactive profiling and for creating profiling reports automatically as part of a regression test suite and/or overnight build.
Performance Validator also allows you to automate this process by launching Performance Validator from the command line. A full range of command line options allow you to perform unattended runs of Performance Validator, complete with HTML export and XML export, to facilitate regression testing as part of your overnight builds.
Command Line
Performance Validator also allows you to automate profiling by launching Performance Validator from the command line.
A full range of command line options allow you to perform unattended profiling with Performance Validator, complete with HTML export and XML export, to facilitate regression testing as part of your overnight builds.
Example 1 Launch a program, record profiling data and save the session.
performanceValidator.exe -program "c:\myProgram.exe"
                         -saveSession "c:\myResults\session1.pvm"
                         -displayUI -refreshStatistics -refreshAnalysis -refreshCallTree
Example 2 Launch a program with a specific startup directory, record profiling data and save the session. A previous session is loaded and compared to the recorded session, the results are exported to HTML.
performanceValidator.exe -program "c:\myProgram.exe"
                         -saveSession "c:\myResults\session1.pvm"
                         -displayUI -refreshStatistics -refreshAnalysis -refreshCallTree
                         -directory "c:\testarea"
                         -sessionLoad "c:\myResults\session1.pvm"
                         -compareByParentTime
                         -exportAsHTML "c:\myResults\session2.html"
                         -sessionCompareHTML "c:\myResults\comparison_1_2.html"
Software Updates
We update our software tools on a regular basis – on average about 26 updates per year. Updates are optional, you only need to download the most recent update to be up-to-date.
You can set up automatic software updates using the credentials we supply to you when you purchase. Automatic software updates can be setup to check daily, weekly, monthly or never.
Performance Validator Feature List
Six different performance monitoring methods
- CPU cycles per thread
- timestamp counters
- performance counters
- 1ms counters
- call count
- sampling profiler
Up to twenty different statistics displayed on statistics views, hierarchical display of data on other views. The statistics displayed are customizable by the user. Statistics displayed per performance node in the profiler graph are:
- Class
- Function
- Address
- Module
- Filename
- Number of Children
- Call Count
- Call Count %
- Function Time
- Function Time %
- Average Time
- Average Time %
- Children Time
- Children Time %
- Total Time
- Total Time %
- Longest Time
- Longest Time %
- Shortest Time
- Shortest Time %
- Profile only the parts of the application you are interested in. You can exclude specific DLLs from profiling. This feature allows you to exclude third party DLLs from profiling.
- Selective profiling. The ability to turn profiling on when a function is entered and turn the profiling off when the function is exited. Multiple functions can be specified. This feature allows you to concentrate on exactly the areas of your application you are interested in.
Data searches are performed using the analysis view. The standard queries are:
- Class
- Function
- File name
- Module name
- Address
- Number of children
- Average Time
- Average Time %
- Total Time
- Total Time %
- Function Time
- Function Time %
- Child Functions Time
- Child Functions Time %
- Longest Time
- Longest Time %
- Shortest Time
- Shortest Time %
- Visit Count
- Visit Count %
- Most Visited Hotspots
- Most Time Consuming Hotspots
- Number of descendants
- Number of ascendants
- Distance to root
- Distance to leaf
These queries can be combined with a variety of comparisons and range specifications to fine tune the search. The range specifications are user defined. The comparisons are:
- <
- <=
- ==
- >=
- >
- !=
- Inside range
- Outside range
- Support for executing from the command line, allowing automated performance monitoring for all your regression tests. The command line also provides control over the HTML and XML export functions.
- Support for session comparisons so that multiple sessions can be compared against a baseline session. This is vital for regression test support to detect when performance differs from the expected.
- Interactive session comparisons. You can compare sessions using the user interface and view the results immediately.
- Session-to-session comparison.
- Command line execution.
- Support for regression testing.
- Data export (HTML, XML).
- Start by injecting into a running process
- Start by launching a process and injecting into that process at startup.
- Start by waiting for a process to start and injecting into that process at startup.
- Link to service binary to use Performance Validator with your NT Service.
- No need to rebuild or relink your application. Simply requires PDB, TDS, DWARF, STABS, COFF debug information and/or MAP files for each module (DLL/EXE) in the application.
- Minimal compile and link to use Performance Validator with NT services. This is required because the windows security model does not allow process handles to be opened on service processes by processes other than the service.