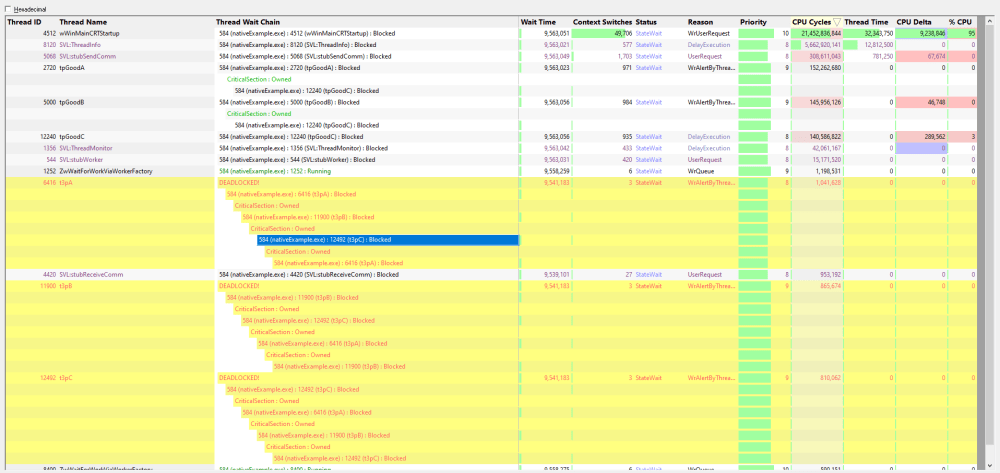
The Wait Chains tab displays information about all the wait chains for the application being monitored.
The Display
Wait chain information is colour coded. Errors are displayed in red, healthy statuses in black and green. Software Verify threads are displayed in purple so that they are easily identifiable as "not your threads".
For any selected thread, that thread and related threads are shown with a yellow background. This is useful so easily identifying threads that are interacting with each other (in a deadlock or a complex wait), or which are not interacting with any other thread at all.
Information that is displayed about each thread:
Thread id
This is the numeric identifier assigned to the thread by the Windows operating system.
Thread Name
This is the name of the thread if the thread has been given a name using the SetThreadDescription() API. This is only available on Windows 10.
If a thread description is not available we use any thread name that is provided using the Microsoft Thread Naming Exception.
If a thread description is not available by either of the above two methods we attempt to provide a name for this thread by querying the thread's start address, and if successful we try to turn this start address into a useful symbolic name. Depending on the process and the operating system these operations may success, in which we display a name, or they may fail in which case we display nothing.
Thread Wait Chain
This is the wait chain for this thread. For each entry we show the process id and the thread id and if the object being waited upon has a name, we show that too. If process names and thread names have been enabled we show these as well. Some wait chains rely on waiting for other processes, which are more readily identified by process name than process id. Any deadlocks that are detected are shown in red.
Wait Time
This is how long the thread has been waiting.
Context switches
This is the number of context switches this thread has been involved in.
Status
The status of this thread. Is the thread running, waiting, sleeping, etc.
Reason
The reason for the status of this thread if the thread is waiting.
Priority
The thread priority.
Cpu Cycles
The number of cpu cycles spent executing this thread.
Thread Time
The amount of time spent executing this thread (returned by the GetThreadTimes() API).
CAUTION! This value can be misleading as it only counts whole thread quanta that complete, any thread that switches before it's quanta is complete doesn't add to this count.
Cpu Delta
The amount of cpu cycles spent executing this thread since the last time we updated the display.
CPU
The percentage of CPU that is being used by this thread (percentage relative to this process, not relative to all processes).
Controls
There is only one control for this display
•Hexadecimal  displays values in hexadecimal when selected, decimal when not selected
Context Menu
If you right click on the grid, a context menu is displayed.
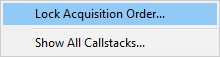
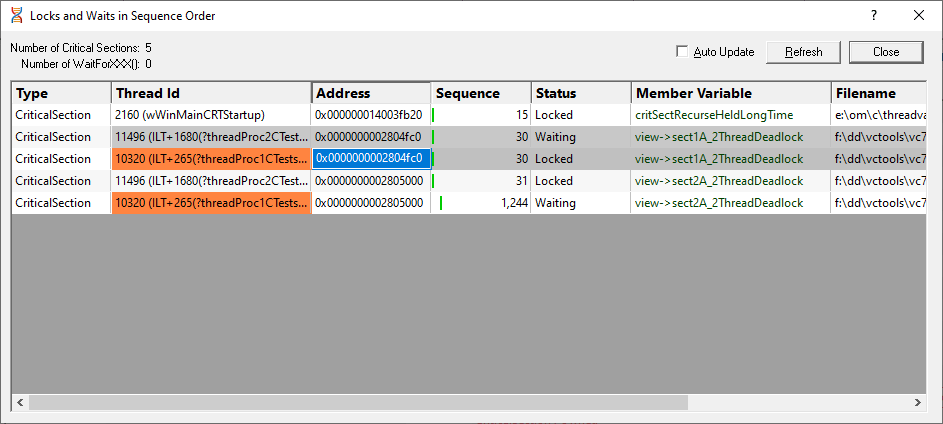
•Lock Acquisition Order... displays a dialog to allow you to view the order the locks in a wait chain were acquired.
In the image below, the locks are all involved in a deadlock over which context menu was displayed.
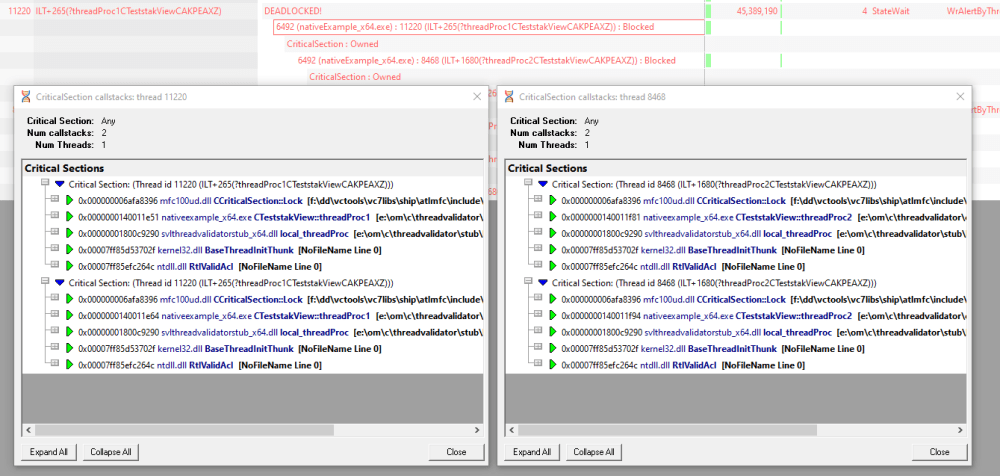
•Show All Callstacks... for the selected lock (or all locks involved in a wait chain) the callstack for that lock is displayed.