The Locks Per Thread displays information about the critical sections and WaitForXXXObject calls used by each thread in the application being monitored.
 Read on, or click a part of the image below to jump straight to the help for that area.
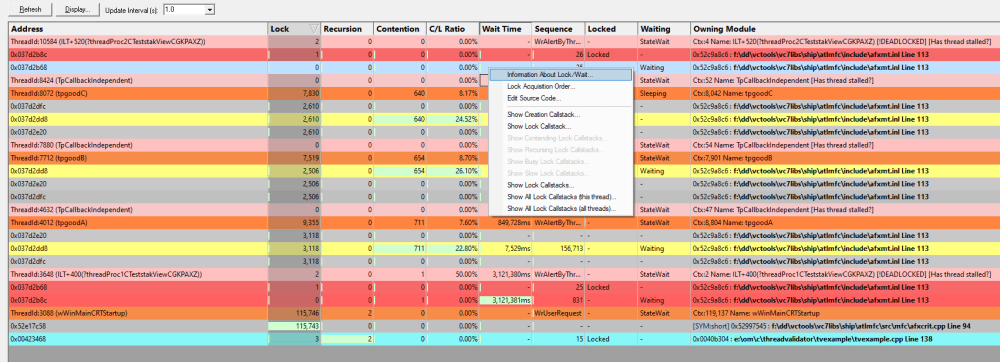
The Locks Per Thread View
The view shows information about critical sections used by each thread in the target application.
In the example above, information for six threads are displayed, with each thread having with a summary header row identified by the ThreadId:nnn in the Address field.
An additional three threads (TpCallbackIndependent) are shown but have no associated locks or waits.
Thread rows will be highlighted orange  (thread information colour), or pale red
  (the stalled thread colour) unless you customise these colours.
Each relevant critical section is shown once underneath each thread and the display can be sorted by different criteria by clicking on the appropriate column header.
The table highlights error and status conditions using the user defined lock colours. In the example above, red  indicates a deadlock, and cyan
  for recursion.
Lines highlighted in grey  denote an active status, meaning that the critical section has been entered.
Unlike the All Locks tab, critical sections where nothing of interest has happened are not displayed.
Any WaitForXXXObject calls used by each thread in the application are also listed.
What data is available?
The following tables list all the available columns of data.
 Note that the thread header rows display different information to the critical section rows.
For critical section rows:
Attribute |
Description
|
•Address |
Address of the critical section, the handle for a WaitForSingleObject call, or the number of handles for a WaitForMultipleObjects call.
|
•Lock |
Number of times the critical section has been locked by any thread.
|
•Recursion |
Number of times the critical section has been re-entered whilst locked by the current thread.
|
•Contention |
Number of attempts a thread has made to acquire the critical section but has had to wait because it is owned by another thread.
|
•Wait Time |
Total time spent waiting by all threads to gain access to this critical section.
|
•Sequence |
The sequence id is an internal monotonic integer that is incremented for each synchronization object event. This integer allows you to identify the order in which events occurred.
|
•Locked |
Shows "Locked" if the critical section is locked.
|
•Waiting |
Shows "Waiting" if the critical section is waiting. |
•Owning Module |
One or more of the following values if available, shown in order of priority with most important first:
•Thread name only if the thread has been given a name, the thread name is also displayed •Filename and line number of the code location that acquired the lock, determined from the callstack (if collected) •Filename and line number of the critical section •Name of the owning module, if the critical section is static data inside a module (DLL or EXE) •Data indicating dynamic memory or stack space
Some of these details can be optionally hidden using the Display options. |
For thread header rows, the information is typically a total for the thread as a whole, or an indication of thread state.
Attribute |
Description
|
•Address |
Thread Id
|
•Lock |
The total number of locks acquired by this thread
|
•Recursion |
The total number of context switches performed by this thread
|
•Contention |
The total number of critical section contentions for this thread
|
•C/L Ratio |
The percentage of the total contentions over the total number of locks for this thread |
•Wait Time |
The total number time spent waiting for access to critical sections
|
•Sequence |
Not used
|
•Locked |
Not used |
•Waiting |
The current state of the thread - as obtained by polling the operating system for data at regular intervals. As such this information may not match the other data at all times. |
•Owning Module |
Information about thread errors. As an example, in the image at the top of this page the thread entry lines (starting with ThreadId::nnn in the Address column), you can see that the data for deadlocked threads reads [!DEADLOCKED] and the data for threads with recursions reads [!Locking errors], indicating serious errors for these threads.
Other messages might indicate that the thread is suspended, sleeping, stalled or has had an exit from a critical section that has not been entered. |
Percentage bars and markers
All the cells in the table that show timing or count data for critical sections have a percentage bar indicating the item's value relative to the maximum value in the column.
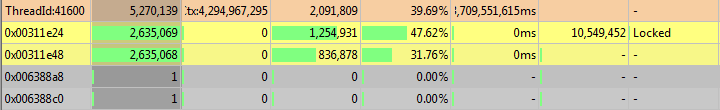
Not all bars are percentages. In the Sequence column, the markers indicate the relative position of the sequence id (see table above) with respect to the first sequence id and most recent sequence id. Thread header rows show the marker position for the highest sequence id of any locks in that thread.
Updating the display
•Update Interval  automatically updates the display at your choice of interval, from 0.1 to 60 seconds
This should be set depending on the complexity of your application.
An update interval that is too short may mean Thread Validator spends too much time updating the display.
•Refresh updates the display - as does the  button on the Tools menu and toolbar
Sorting the data
You can sort the data in the table by clicking in the table header.
See what data is available for descriptions of each column
Note that while your application is executing, the sorted data is live. Sorting may not complete correctly as the data may change during the sort. Only when your program has finished executing is the sorted data guaranteed accurate.
Display settings
The Locks Settings dialog controls a small number of highlighting and display options.
•Display... show the Locks Per Thread Settings dialog:
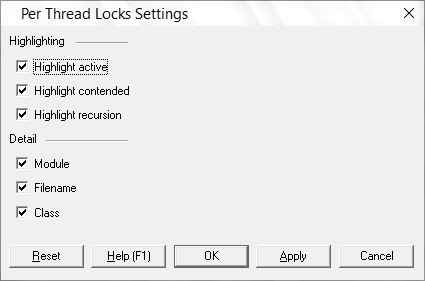
Highlighting settings:
•Highlight active initialised (entered) critical sections are shown in the active colour (grey by default)
•Highlight contended critical sections that have had to wait are shown in the contending colour (yellow  )
)
•Highlight recursion re-entered critical sections are shown in the recursion colour (cyan )
The next three display settings control the display of Module, Filename and Class in the Owning Module data column.
Other options include:
•Reset resets these values to their startup values (all checked)
•Apply apply the settings to the Locks view without closing the dialog
Locks Per Thread menu options
The following popup menu is available over the data area to add filters, examine more details or edit code.
Menu actions apply to the function for the row at the menu-click location.
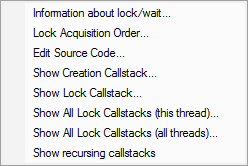
Menu options: Information about lock or wait
•Information about lock/wait... shows the relevant information dialog from those shown for the same menu option on the All Locks tab
Menu options: Lock acquisition order
•Lock Acquisition Order shows the Locks and Waits in Sequence Order dialog
This dialog displays the order...
•in which critical sections are locked and waited upon
•that waits are entered into
•in which threads sleep and are suspended
Menu option: editing source code
•Edit Source Code... opens the default or preferred editor to edit the source code
Menu options: show ... callstacks
Each of these four options show the Critical Section Callstack dialog for the selected item's callstack
•Show Creation Callstack... shows the callstack for the creation of this item, i.e. the locked or waiting critical section and thread
•Show Lock Callstack... shows the callstack for the locked or waiting critical section and thread
•Show All Lock Callstacks (this thread)... shows all callstacks for this critical section and only this thread
•Show All Lock Callstacks (all threads)... as above but for any thread
The following menu item is only available over recursing critical sections (highlighted in light blue by default)
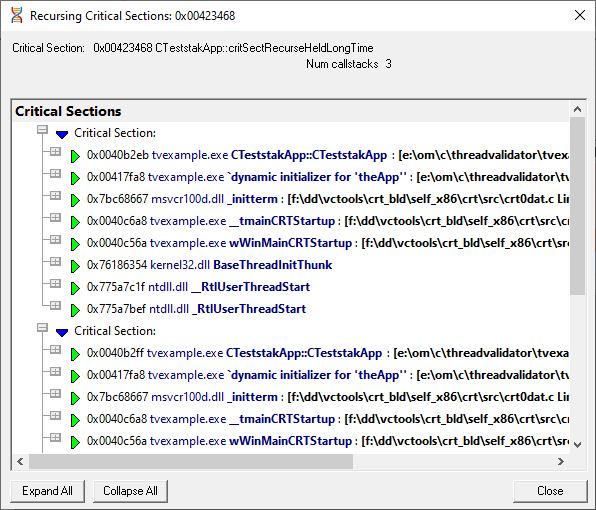
•Show recursing callstack... shows the Recursing Critical Sections dialog for this item
The critical section in question is shown at the top.
This dialog can only be shown if the callstack information is still available. If not you'll hear a beep.
The following menu item is only available over contended critical sections (highlighted in yellow by default)
•Show contended callstacks... shows the Contended Critical Sections dialog for this item
This dialog is very similar to the one for recursions, above.
As above, this dialog can only be shown if the callstack information is still available. If not you'll hear a beep.
The following menu item is only available over recursing critical sections (highlighted in light blue by default)
•Show recursion callstacks... shows the Recursing Critical Sections dialog for this item
This dialog is very similar to the one for contentions, above.
As above, this dialog can only be shown if the callstack information is still available. If not you'll hear a beep.
•Show busy lock callstacks... shows the busy Critical Sections dialog for this item
This dialog is very similar to the one for contentions, above.
As above, this dialog can only be shown if the callstack information is still available. If not you'll hear a beep.
•Show slow lock callstacks... shows the slow Critical Sections dialog for this item
This dialog is very similar to the one for contentions, above.
As above, this dialog can only be shown if the callstack information is still available. If not you'll hear a beep.
•Show lock callstacks... shows the Critical Sections dialog for this item
This dialog is very similar to the one for contentions, above.
As above, this dialog can only be shown if the callstack information is still available. If not you'll hear a beep.
•Show all lock callstacks (this thread)... shows the Critical Sections dialog for this item
This dialog is very similar to the one for contentions, above.
As above, this dialog can only be shown if the callstack information is still available. If not you'll hear a beep.
•Show all lock callstacks (all threads)... shows the Critical Sections dialog for this item
This dialog is very similar to the one for contentions, above.
As above, this dialog can only be shown if the callstack information is still available. If not you'll hear a beep.