Injecting into a running program
Performance Validator attaches to a running process by injecting the stub into the process so it can start collecting data.
Choose one of these methods of starting the injection:
 Launch menu
  Applications Inject... shows the Attach to Running Process wizard or dialog below
Or click on the Inject icon on the session toolbar.

Or use the shortcut
 Inject into running application
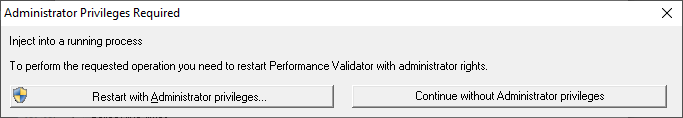
Administrator privileges
The following applies only if you did not start Performance Validator in administrator mode.
When choosing the inject method described in this topic, a restart of Performance Validator with administrator privileges will be required to proceed.
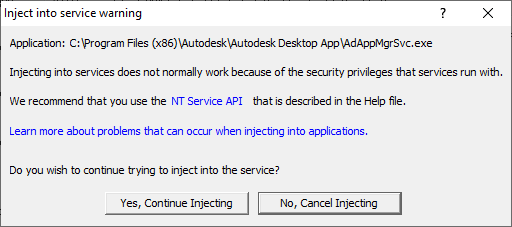
Injecting into a service?
If your process is a service, Performance Validator won't be able to attach to it.
Services can't have process handles opened by third party applications, even with Administrator privileges.
In order to work with services, you can use the NT service API and monitor the service
You may see this warning dialog when trying to inject into a service:
User interface mode
There are two interface modes used while starting a program
•Wizard mode guides you through the tasks in a linear fashion
•Dialog mode has all options contained in a single dialog
All the options are the same - just in slightly different places
In this section we'll cover the Wizard mode first and the Dialog mode later.
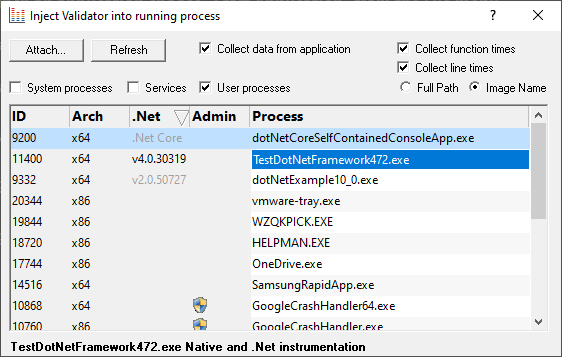
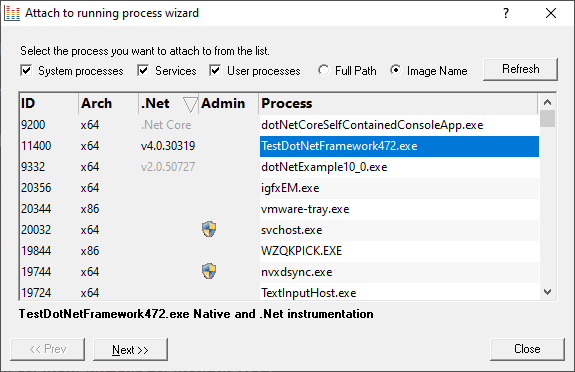
The attach to running process wizard
The first page of the wizard shows a list of running system and user processes.
The Arch column is not shown when running 32 bit Performance Validator because only 32 bit processes are listed.
Any processes that have grayed out .Net values cannot instrument the .Net part of the application (native components will be instrumented).
The list shows the following information:
•ID The process ID
•Admin may show a ![]() symbol to indicate a requirement for administrator privileges in order to run the program.
symbol to indicate a requirement for administrator privileges in order to run the program.
This requirement is automatically detected from the manifest for the process.
•Process The process executable name
Choose a process before continuing:
•Next >> move to the next page of the wizard
The button will show the ![]() symbol if you have selected a process which requires elevated privileges to run.
symbol if you have selected a process which requires elevated privileges to run.
Page 1: Choosing the process
•System processes / Services / User processes show any or all of services and system or user processes in the list
•Full path shows the full path to the process executable in the list
•Image Name shows the short program name without path
•Refresh update the list with currently running processes
Clicking on the headers of the list will sort them by ID or by name using the full name or short name, depending on what's displayed.
Page 2: Data collection
The second page controls what information to collect and when to start collecting it.
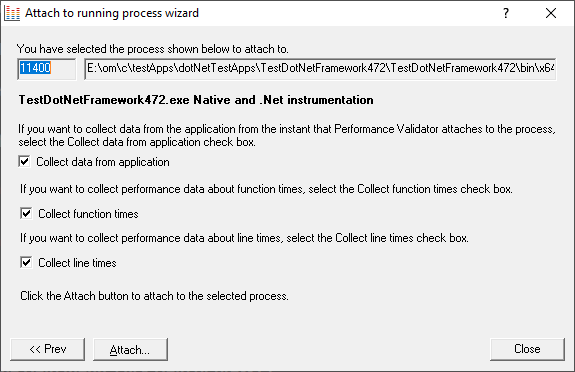
Depending on your application, and what you want to test, you may want to start collecting data as soon as injection happens, or do it later.
If your program has a complex start-up procedure, initialising lots of data, it may be much faster not to collect data until the program has launched.
•Collect data from application if it's the startup performance you want to monitor, then obviously start collecting data from launch
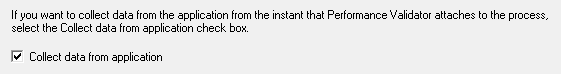
 See the section on controlling data collection for how to turn collection on and off after launch.
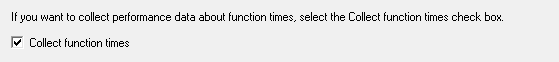
•Collect function times tick to collect data that will allow overall function timings to be calculated
•Collect line times tick to allow individual line timings to be calculated
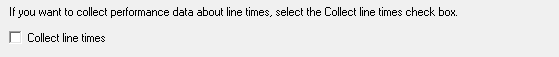
A warning dialog may be displayed to remind you of the possible performance slowdown when using line timing.
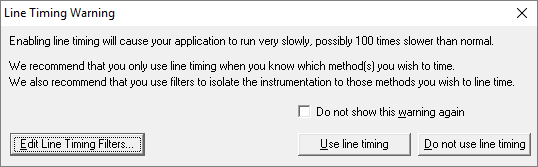
This warning only appears if the Enable line timing warning option on the Performance settings is checked.
The option at the bottom to edit line timing filters can be used to set specific classes, methods and functions to be included in, or excluded from, the hooking process and is identical to the Line Timing Filters page of the global settings dialog.
 Unchecking function and line times means not collecting any data at all!
Currently we only support attaching to native applications and the native part of mixed mode applications.
Summary and starting your program
The second page also confirms at the top which process you have selected to inject into, and prompts you to attach:
•Attach... injects Performance Validator into the specified process, showing progress status
The button will show the ![]() symbol if you have selected a process which requires elevated privileges to run.
symbol if you have selected a process which requires elevated privileges to run.
In the general questions see Why might Inject or Launch fail? for troubleshooting launch problems.
Dialog mode
In Dialog mode, all the settings are in one dialog but which still looks similar to the first page of the wizard above.
The option of when to start collecting data, and whether to collect function and line times is at the top, as is the Attach... button itself.