Exporting to HTML or XML
Exporting sessions allows you to use external tools to analyse or view session data for whatever reasons you might need.
You can export to HTML or XML format:
 File menu
  Export Session... Choose an HTML or XML Report shows the Export Session dialog below
Exporting is not saving
You can't import session data.
Use save and load if you want to save session data for loading back into Performance Validator at a later date.
The HTML and XML export session dialog
For HTML or XML export, the same dialog is used, but the call tree and call graph options are disabled for XML.
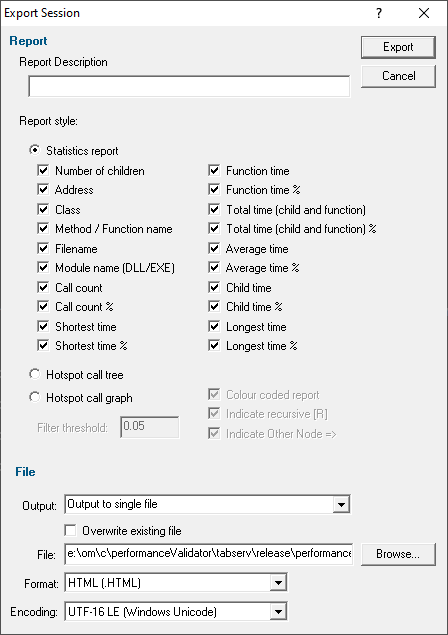
Report description
The optional description is included at the top of the exported html in the description field.
•Description enter a meaningful description or just leave blank
If no text is entered the description is omitted from the export.
Report Type
•Colour Coded Report generate a colour coded report
Only HTML reports can be colour coded:
Colours used will be those set for use in the various displays.
Report style
The report can take the form of a table of statistics or a hierarchical call tree or graph:
•Statistics report exports tabulated data with all the checked items below, similar to the Statistics tab view
The exported report can be generated on a per source-file basis, or as a concatenated set of performance data - see the File section below.
•Hotspot call tree exports hierarchical data similar to the Call Tree tab view
•Hotspot call graph exports hierarchical data similar to the Call Graph tab view
Options when exporting trees and graphs
Exported HTML trees and graphs are interactive in that items can be expanded and collapsed and are colour coded according to the current colour scheme.
You may not want to export functions that are below a certain threshold contribution to the total time
•Filter threshold enter a threshold percentage value between 0.00 and 1.00
Any functions below the threshold will not be exported.
Trees and graphs can produce colour coded reports and may have recursive nodes:
•Colour coded report produce a coloured or monochrome export
The colours used are the same as in the various displays in C++ Performance Validator.
•Indicate recursive mark recursive nodes in the report with [R]
When exporting as a call graph the items can also indicate linked nodes:
•Indicate Other Node mark nodes found elsewhere in the graph with =>
Statistics report content
When exporting a statistics report, all the ticked items on the dialog will be included.
Function details (names and locations)
•Number of children number of child functions
•Address function address
•Class class name
•Method / Function name method name (or function name if no class
•Filename filename containing the function
•Module name name of the module containing the function
Statistics (counts and timings)
•Call count number of times the function is called
•Call count% as a percentage of all function calls made
•Function time the time a function takes to execute
•Function time % as a percentage of runtime
•Total time the time a function and its child functions take to execute
•Total time % as a percentage of runtime
•Average time average time a function takes to execute
•Average time % as a percentage of runtime
•Child time the time a function's child functions take to execute
•Child time % as a percentage of runtime
•Shortest time the shortest time a function and its child functions take to execute
•Shortest time % as a percentage of runtime
•Longest time the longest time a function and its child functions take to execute
•Longest time % as a percentage of runtime
File section
•Output Choose whether to export everything to a single file, or one output per source file
For multi-file reports an additional index.html or index.xml file is also created.
This only applies to the statistics report, not the call tree or graph output.
•Overwrite existing file check if you don't want to be warned about overwrites when exporting as a single file
•File/Directory type the export location or Browse to a location
Enter the filename for single file export, or the directory path for multi-file export.
•Format set whether exporting HTML or XML
This defaults to the original menu option selected, but is included here to more easily export one format and then the other.
 If you need to customise your HTML, we recommend first exporting a detailed XML report and using that to generate an HTML report styled as required.
If you are exporting XML data you will want to know the XML export tags that are used.
•Encoding set whether UTF-16 LE, UTF-8 or ASCII encoding. By default the exported file is saved in the Windows Unicode format UTF-16 little endian. You can also save in UTF-8 and ASCII. ASCII has no byte order mark at the start of the file.
Ready to export?
•OK (at top right) start exporting the session data
Once the export is complete, a confirmation dialog will be displayed.
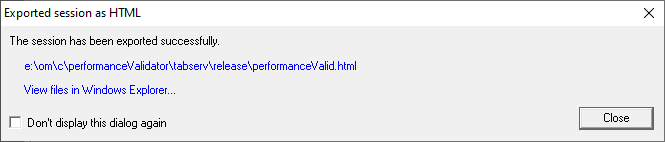
The links in the dialog provide direct access to either the export directory in Windows Explorer, or to open the exported file itself using the default application for xml or html files.
If you produced a multi-file export then the browser link will be for the index file, as above.