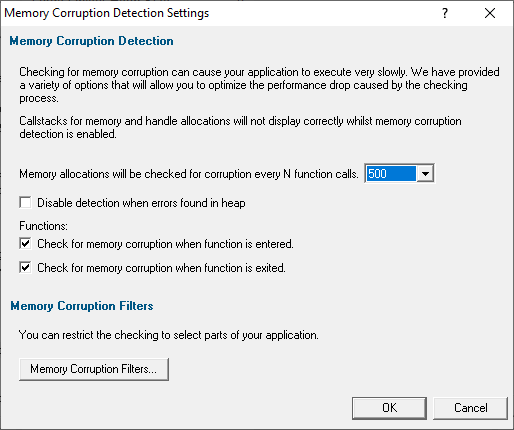
The Memory Corruption Detection tab provides controls for detect memory corruption effectively while reducing the performance hit involved
 The picture below shows this tab with the setting enabled, but the default setting is not to enable detection of memory corruption
How is memory corruption tested for?
Memory corruption is detected by visiting every memory allocation in the CRT heap and checking the entries in each location to see if the guard blocks on either side of the allocation are still valid.
In addition, any free blocks the CRT heap is still holding are also checked, to ensure that they have not been written to.
Note that this only works for DEBUG builds as information in the DEBUG heap is required to enable this detection.
Detecting memory corruption
Memory Validator can detect memory corruption at the entry and exit points of functions in your application.
•Detect Memory Corruption  enables detection
Note that uninitialised data detection is disabled when this feature is enabled, and also callstacks for memory and handle allocations will not display correctly
The default setting is not to detect memory corruption as it can significantly affect performance speed.
 Why does detecting memory curruption affect performance so much? Enabling detecting memory corruption will cause a serious performance degradation for your application. This is because, in general, the longer your application executes, the more memory the application has used. This means the CRT heap has more allocations in it, and thus the task of checking the CRT heap for corruption takes longer. For small applications, or applications that allocate small amounts of memory the performance hit will not be too great. For other applications the performance hit will be quite high.
Once detection is enabled, the other settings help lower the impact on performance by reducing frequency of checks:
•Check for memory corruption every N functions calls reduces the performance hit by less frequent corruption checks
The default is every 500 calls, but you can change it in the range 1 to 100,000.
 See below for how to use this setting effectively with the memory corruption filters which are also described below.
•Disable detection when errors found in heap stops detecting more memory corruption errors once an error has been found.
The default is continue detection even after errors are found (i.e. the checkbox is off by default)
•Check for memory corruption when function is...
...entered perform checks before executing a function
...exited perform checks after execution
Understanding the memory corruption results
When a memory corruption is detected, the main Memory tab shows the following items:
•some data to indicate the memory allocations that have been corrupted (one line may relate to one or more corruptions)
•a last known callstack prior to this corruption being detected
•a callstack of the location when the corruption was detected
The two callstacks help to identify the area of the program between them as the potential cause of the memory corruption.
In the example below line id:482 shows that two objects of 10 bytes were corrupted, followed by a last known good and bad callstack for each corruption detected.
The known good callstack at line id:484 will show the last location in the program at which the CRT heap was known not to have been corrupted (or if already corrupted, then at least not corrupted any more!).
Finally, the known bad callstack at line id:485 is shown expanded and indicates the location at which the memory corruption was detected. Note that this is not necessarily the point at which memory was actually corrupted, as this depends on the value of N described above.
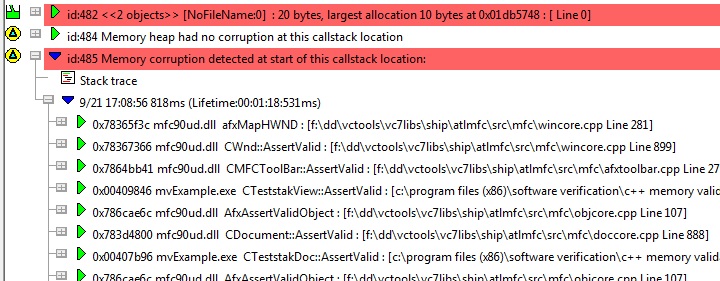
Because line id:482 related to two corruption detections, another good and bad callstack would be displayed below those shown here.
Memory corruption filters
Because of the performance hit of detecting memory corruption, it can be advisable to constrain detection to only part of an application.
To do this, you specify 'detectors' that switch the checking on and off.
A detector specifies a function name to which it applies and a status that applies when the program reaches the detector. When the program leaves the detector function, the previous status is applied.
Using the yellow check box, detectors can be disabled so as not to affect the detection status.
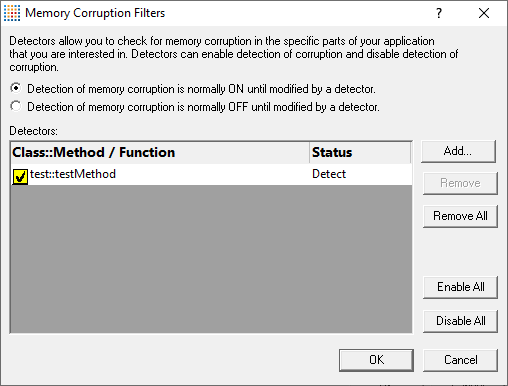
•Memory Corruption Filters... display the Memory Corruption Filters dialog (see below)
Using memory corruption filters
•Detection of memory corruption is normally ON / OFF until modified by a detector sets the default detection state
•Add... enter function, or class::method in column 1 Click column 2 to add the state (default is Detect), double click to change it to Don't Detect.
Detectors are initially enabled. To disable a detector, use the yellow check box.
The function name can take the forms below - no need to specify return types or argument types
•className::methodName Matches class name and method name exactly
•className:: Any method in class className
•::methodName Matches method methodName in any class
•functionName Matches function name only
•Remove removes selected detectors from the list
•Remove All removes all detectors from the list
•Enable All enables all detectors
•Disable All disables all detectors
These don't affect the Detect status in column 2
Note that data collection is still subject to the global data collection flags, so turn global data collection off also turns off memory corruption detection
Example of using memory corruption filters
Consider an application where only the myApp::sortThisData() function, and all functions called from it are of interest:
Choose Detection of memory corruption is normally OFF until modified by a detector sets default checking state to OFF
Then Add... enter myApp::sortThisData() in first column of the table click in the second column to choose Detect
When the application reaches myApp::sortThisData() the detection of memory corruption is turned ON because of the Detect status.
The application runs as normal, and memory corruption is detected, until myApp::sortThisData() finishes executing.
At this point the previous detection status (OFF) is restored.
Using the filters and the 'check every N functions' settings together
Setting N to 1 checks the CRT heap at every function entry and exit and corruption will be detected very close to the actual line of source code that caused the problem. However, the performance hit will be high - huge in fact, for larger applications.
Setting N to, say 100, means the performance hit will be lower, but up to 100 functions may have been called between the memory corruption and its detection.
One strategy might be to start with a high value for N to get a feel for which part of the application is causing the corruption.
Then hone in on the corruption by using the memory corruption filters to focus on that part of the application, and decrease N to 1 so that every function entry and exit is monitored inside the area covered by the filters.
Reset All - Resets all global settings, not just those on the current page.
Reset - Resets the settings on the current page.