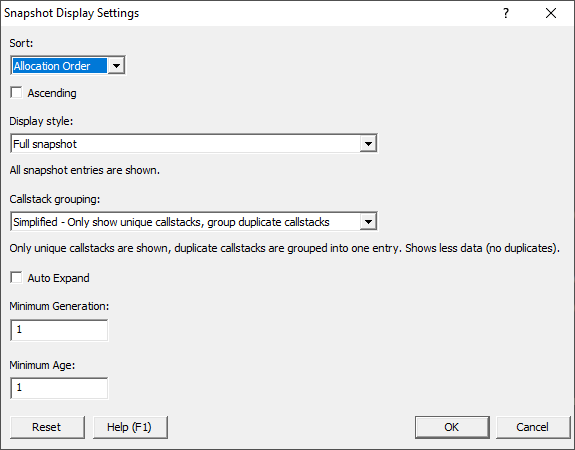
The Snapshot Callstack Display settings dialog allows you to control how data is displayed on the snapshot callstacks display.
Display Ordering
The callstacks in a snapshot can be sorted prior to display.
•Allocation Order  the order objects were allocated in
•Size by the size of the allocation
•Object Type alphabetical comparison of object type
•Filename alphabetical comparison of filename
•Namespace alphabetical comparison of namespace
•Address the object id of each object
Making the data easier to understand
Some options affect how much data is shown. Displaying less data can sometimes make for a more readable display.
•Display Style determine which objects to display.
oFull information about every allocation and error is displayed (unless filtered)
oSimplified - your source code at root Only traces that have a callstack with your source code at the top of the callstack are displayed
oSimplified - your source code not at root Only traces that have a callstack with your source code in the callstack (except for the top position) are displayed
oSimplified - your source code anywhere Only traces that have a callstack with your source code anywhere in the callstack are displayed
oSimplified - compiler vendor source code at root Only traces that have a callstack with your compiler vendor source code at the top of the callstack are displayed
oSimplified - compiler vendor source code not at root Only traces that have a callstack with your compiler vendor source code in the callstack (except for the top position) are displayed
oSimplified - compiler vendor source code anywhere Only traces that have a callstack with your compiler vendor source code anywhere in the callstack are displayed
oSimplified - no source code Only traces that have a callstack with no source code are displayed
•Callstack grouping display all callstacks or just unique callstacks
oFull every callstack is shown
oSimplified - Only show unique callstacks Traces that share the same callstack are displayed once. A summary is shown indicating the number of allocations, how many bytes in those allocations and the size of the largest allocation.
•Minimum Generation only display objects that were created on or after the specified generation. This allows you to ignore objects created at startup, or before a particular point in program execution
•Minimum Age only display objects that have survived at least the specified number of garbage collections. This allows you to ignore objects that are most likely still in use
Callstacks can be displayed in collapsed or expanded form:
•Auto Expand every callstack is displayed expanded so that you can see the callstack as well as the summary