If you are:
•an admin level user
•using Microsoft compilers
•on a modern OS
•already know that you create debug info in your debug and release product
...then you're more than likely good to go and dive in!
Otherwise, we recommend reading these topics before starting:
•What do you need to run Coverage Validator?
Testing on the Example Program
You can test drive the capabilities of Coverage Validator by launching the example program supplied with Coverage Validator - nativeExample.exe.
The example program can be used in conjunction with the Coverage Validator tutorials.
Ensure you have debugging information
Your application needs to be compiled to produce debugging information and linked to make that debugging information. Details are available for enabling debugging information with Visual Studio, C++ Builder, Delphi, MinGW, and other compilers.
If you have no PDB debugging information but you do have a Microsoft format MAP file available, it must contain line number information by using the /MAPINFO:LINES linker directive.
Launching
To start your program click on the launch icon on the session toolbar.

What you see next depends on the user interface mode (wizard or dialog style).
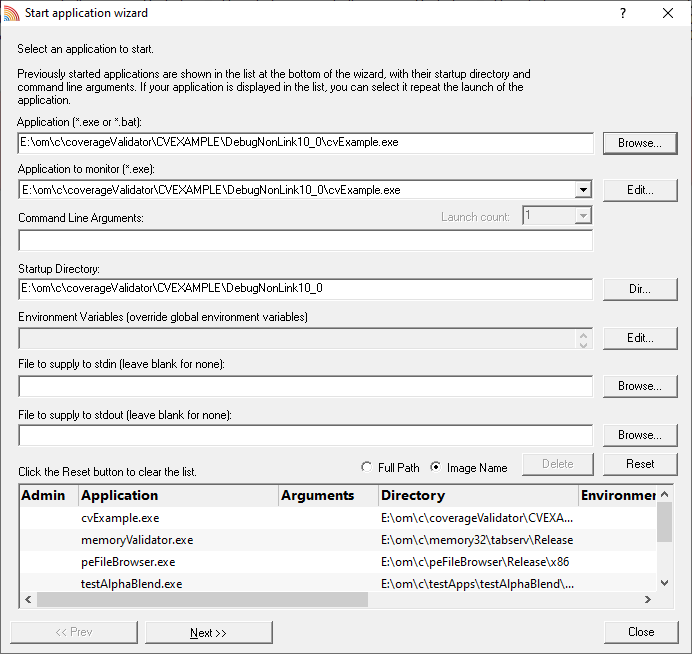
The Launch Wizard...
If you have just installed the software you will be shown the launch wizard:
Click Browse... to choose a program to launch  Next Next Next Start Application...
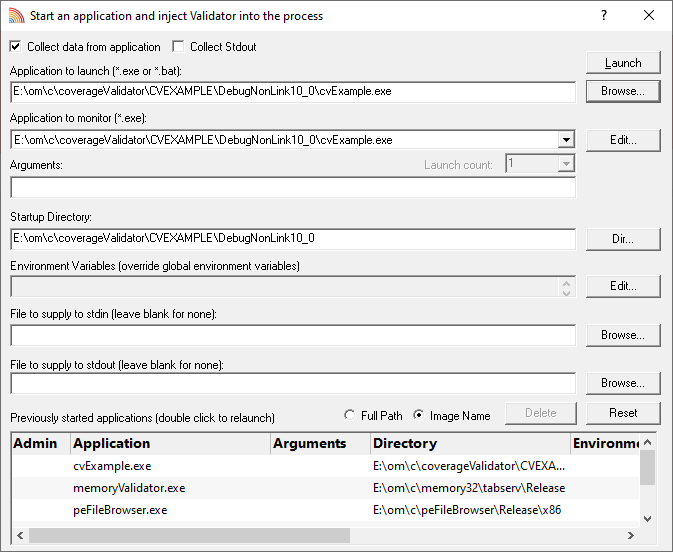
...or the Launch Dialog
If you have switched to Dialog mode you will be shown the launch dialog:
Click Browse... to choose a program to launch Launch
During launch
Coverage Validator will start and inject the stub into the target program. Progress during this phase is displayed in the title header of the main window.
Once correctly installed in the target program, the stub will establish communications with Coverage Validator and data can be collected and viewed until the target program exits.
The Summary Tab and the Coverage Tab will update at intervals to show coverage so far. Other tabs need manually refreshing.
After exit - examining the output
When the target program exits, Coverage Validator closes the session. The data collection icons on the session toolbar are disabled, and the launch icons are enabled again.
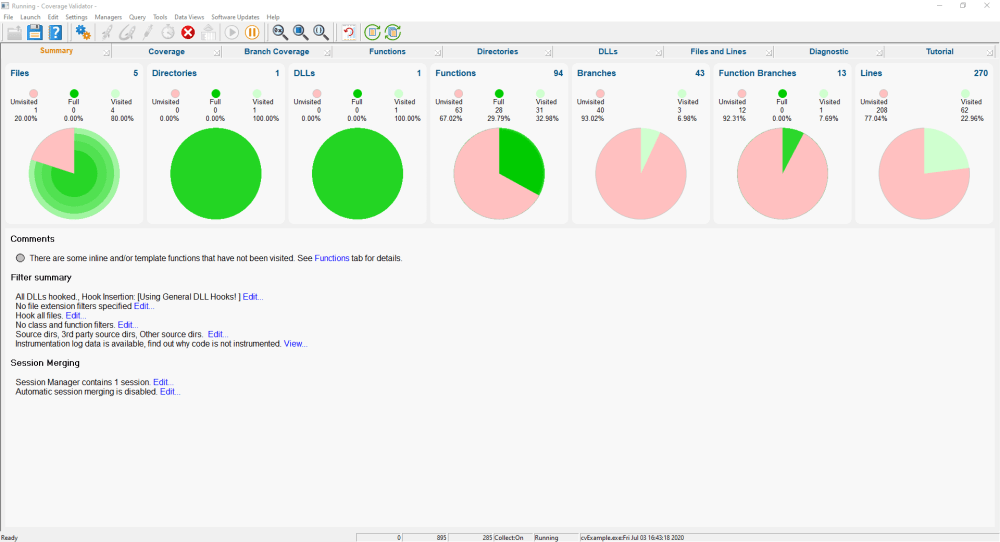
The picture shown below shows an example of the Summary Tab displaying coverage at different granularities.
Some quick takeaways from this dashboard include:
•About 80% of the files were covered, but no individual file had 100% coverage (dial 1)
•A third of the functions were covered, most of those had 100% coverage (dial 4)
•Less than a quarter of all lines of source code were visited (dial 7)
Ending the session
Even though the target program has exited, the session is still active and can be examined or saved until the session is closed via the File menu Close Session.
You can have more than one session open at a time.