Comparing loaded sessions
When two different sessions are loaded they can be compared as part of a manual regression test.
The comparison results are shown as a call tree, detailing the difference in timings at each node.
Session comparison is accessed from the Session Chooser dialog:
 Managers menu
  Session Manager... shows the Session Chooser dialog below, highlighting the current session
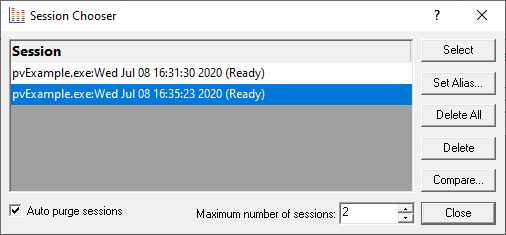
•Compare... shows the Compare Session dialog for comparing performance times.
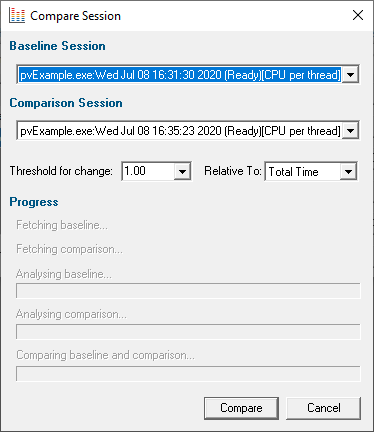
Select the two sessions to compare:
•Baseline session the session you want to compare against
•Comparison session to compare against the baseline
 Both sessions must have used the same performance timing method (shown in square brackets). The Compare button is only enabled when two different sessions of the same timing method are selected.
Set the criteria for making comparisons:
•Threshold for change type or choose a percentage difference below which differences will be ignored
Some variation in timings for different runs of the same code is normal. This threshold helps filter out such 'jitter' in timings.
•Relative to choose whether comparisons are made using timings relative to total run time or 'parent time'.
Depending upon the threshold chosen and whether you opt for total or parent timing, the comparison results can differ quite widely for the same datasets.
Try experimenting with the values to determine those most appropriate for producing meaningful comparisons for your application.
•Compare starts the comparison process and then shows the Session Performance Comparison dialog
The Session Performance Comparison dialog
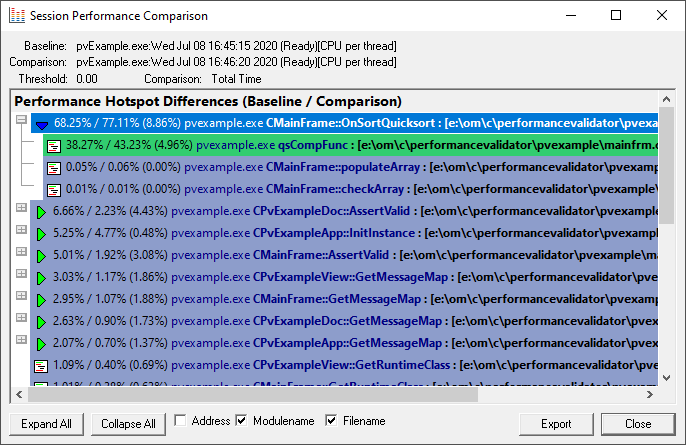
At the top of the dialog you'll see your chosen threshold and comparison method below the baseline and comparison sessions details.
The call tree displays the results of the comparison.
•Expand / Collapse All show or hide every node in the tree
•Address / Filename / Modulename optionally include the function details on each line of the tree
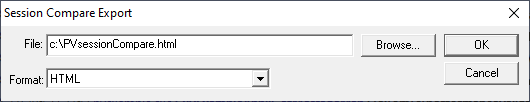
•Export show the Session Compare Export dialog
Choose a filename and export the comparison results as HTML or XML:
A context menu is available on the tree control to allow you to expand and collapse entries and edit source code.
•Edit Source Code... open the source code using the built in editor or your favourite editor if set
•Collapse / Expand Entry hide or show all the tree nodes below the selected item
•Collapse / Expand All hide or show every node in the tree
The session comparison call tree
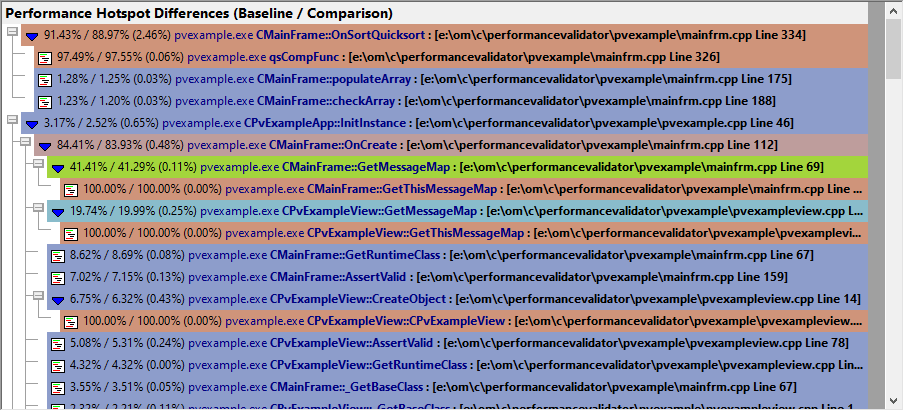
Each item in the call tree shows
•baseline / comparison statistics
•difference between baseline and comparison statistics (in brackets)
•function address, optional
•class::function name
•filename, optional [in square brackets]
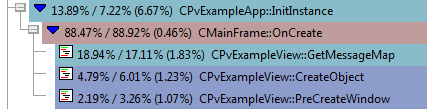
Functions appearing below the threshold?
Functions are only hidden if their own timing and that of each of their child functions fall below the threshold.
In the example below, the threshold was set at 1%.
The OnCreate function, which had a difference of 0.46% is still shown since three of its child functions differed by more than 1%
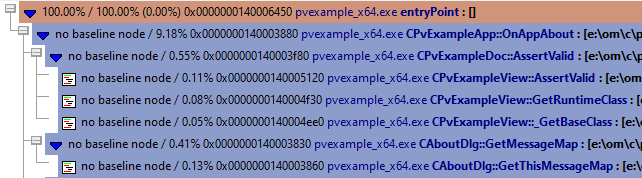
Functions only called in one of the session
Where no function timings exist in one of the sessions, you'll see no baseline node or no comparison node instead of the function statistics.
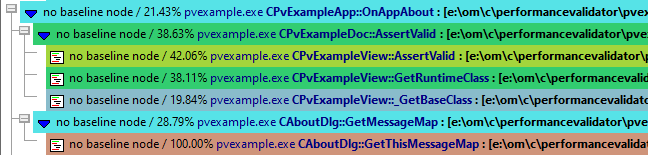
By setting the threshold to 100%, you may be able to get a rough guide as to what parts of your program were called in one session but not in the other.
The example below shows the example application compared with 100% threshold.
You can see the About dialog was shown in the comparison session, while the user chose how many items to sort in the baseline session.
Comparing timing statistics
Use caution when making timing comparisons.
There are many reasons why one run may differ to another - here's just a few:
•Virtual memory paging
A previous run may have resulted in various data caches being populated (at Operating System or database level), resulting in faster runs thereafter.
•Thread scheduling
The Operating System may schedule the threads differently, e.g. because of current loading, hardware device interrupts, etc.
•User interaction timing
Parts of your program relying on user interactions can have relatively large timing discrepancies between runs.
•Network access timing
Program areas reliant on network access (local network or Internet) will have timing discrepancies due to network latency and loading, TCP/IP data loss retransmission and related issues.
Experiment with the Threshold for change setting above to filter out noise in your results due to these effects.