If you're an admin level user, using Microsoft compilers on a modern OS and already know that you create debug info in your debug and release product, then you're more than likely good to go and dive in! Otherwise, we recommend reading these topics before starting:
•What do you need to run Memory Validator?
Default collection of data
If you have just installed Memory Validator the default settings:
•will enable collection of data about the C runtime heap, Win32 heaps and handles
•will not collect data about uninitialized memory, buffer overruns and buffer underruns
Testing on the Example Program
You can test drive the capabilities of Memory Validator using the example program supplied with Memory Validator - nativeExample.exe. This program deliberately leaks memory and provides many menu entries that create even more errors, for all memory heap types, handles, uninitialized data, buffer overruns, buffer underruns and demonstrates the API. (You can disable use of the API by undefining a macro in the source code).
Ensure you have debugging information
Your application needs to be compiled to produce debugging information and linked to make that debugging information. Details are available for enabling debugging information with Visual Studio, C++ Builder, Delphi, MinGW, and other compilers.
If you have no debugging information but you do have a Microsoft format MAP file available the MAP file must contain line number information by using the /MAPINFO:LINES linker directive.
Launching
To start your program click on the launch icon on the session toolbar.

What you see next depends on the user interface mode (wizard or dialog style).
The Launch Wizard...
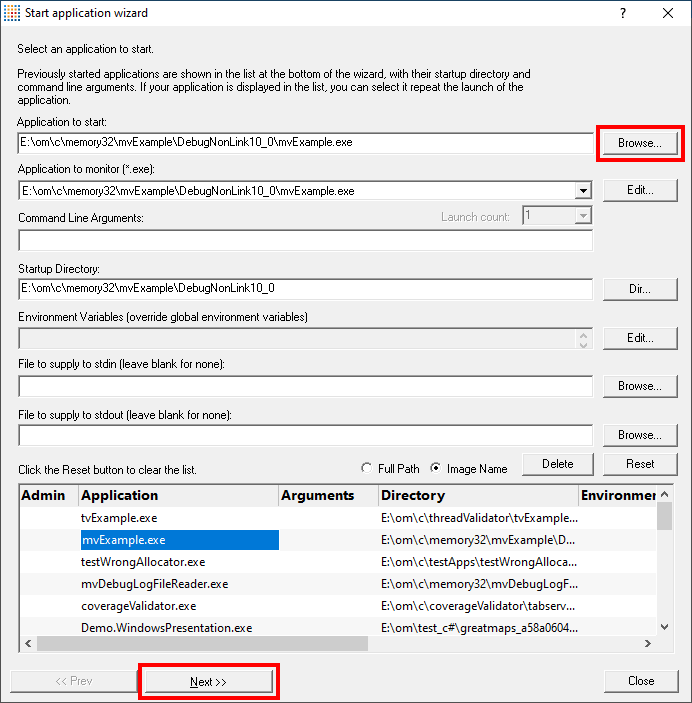
If you have just installed the software you will be shown the launch wizard:
Click Browse... to choose a program to launch  Next Next Start Application...
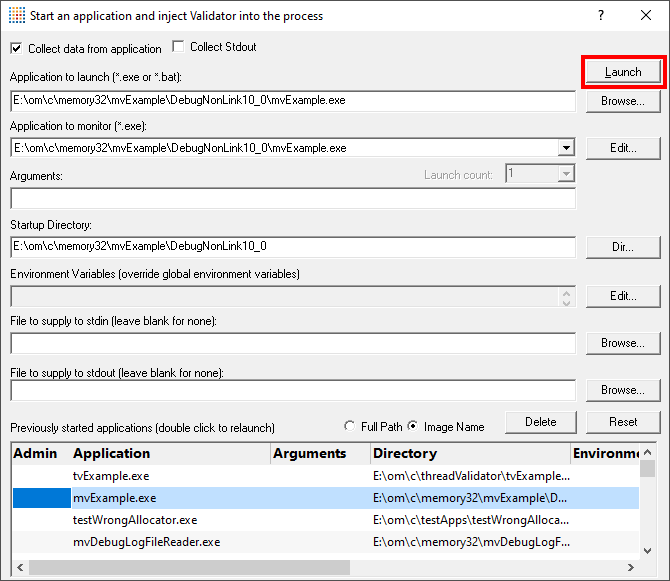
...or the Launch Dialog
If you have switched to Dialog mode you will be shown the launch dialog:
During launch
Memory Validator will start and inject the stub into the target program. Progress during this phase is displayed in the header of the main window.
Once correctly installed in the target program the stub will establish communications with Memory Validator and data can be collected and viewed until the target program exits.
Click on the Refresh button on the left of the Memory Tab, or click on the refresh icon on the toolbar to get a snapshot view of the errors.
After exit - examining the output
When the target program exits, Memory Validator calculates which data items are leaked. The data collection icons on the session toolbar are disabled, and the launch icons are enabled again.
Click on the Refresh button on the left of the Memory Tab, or click on the Refresh icon on the toolbar.

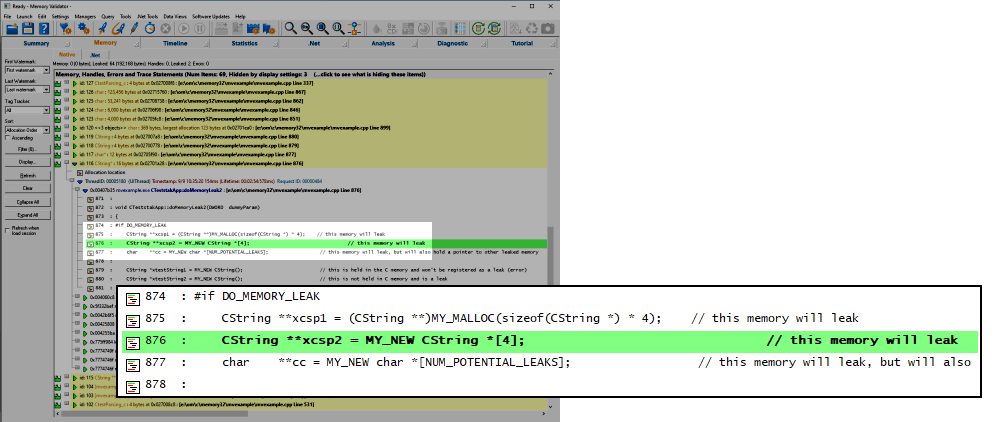
Memory Validator will display data on any outstanding allocations of memory and/or handles. Leaked memory will be shown in yellow, although the colours can be changed from the colour settings tab.
The picture shown below shows the memory tab displaying some memory leaks. One of the leaked objects has had its stack trace expanded showing the source code line responsible for the leak.
Ending the session
Even though the target program has exited, the session is still active and can be examined or saved until the session is closed via the File menu Close Session.