Exporting to HTML or XML
Exporting sessions allows you to use external tools to analyse or view session data for whatever reasons you might need.
You can export to HTML or XML format:
 File menu
  Export Session... Choose HTML Report or XML Report shows the Export Session dialog below
Exporting is not saving
You can't import session data.
Use save and load if you want to save session data for loading back into Memory Validator at a later date.
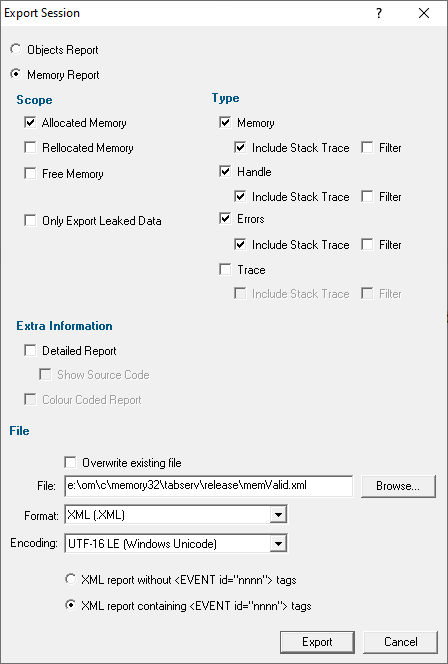
The Export Session dialog
The Export Session dialog looks very similar to the Save Session dialog, except there are more options enabled.
Memory or Types
Choose to export type data or memory data:
•Types Report will export a set of data corresponding to the Types tab view
•Memory Report will export memory allocations, types, callstacks etc
A Types Report will disable all the other options apart from the File settings.
If exporting a memory report, choose the options in the Scope, Type and Extra Information sections:
Scope section
•Allocated Memory all memory and resource allocations not deallocated and information about damaged memory
•Reallocated Memory all allocations that have been reallocated
•Free Memory all allocations that have been deallocated
•Only Export Leaked Data check to export memory known to have leaked
Useful if using in-place leak detection during a session and want to export data before the session completes.
•Include Data Marks as Fixed allocations marked as fixed
Type section
Choose what type of data you want to include
•Memory memory allocations, reallocations and deallocations
•Handle resource allocations and deallocations
•Errors error conditions such as damaged memory, incorrect deallocation, uninitialized memory
•Trace TRACE() and OutputDebugString() messages
•Watermark watermarks added via the API, watermarks added manually and watermarks added for each garbage collection
For each type of data
•Include Stack Trace includes the allocation stack trace information in the export
•Filter filters the exported data according to the global and the session filters
Leaving the export unfiltered (the default) will export all related data
Extra Information section
•Detailed Report adds Thread ID and timestamp information to the report
•Show Source Code if choosing a detailed report, includes the source code fragments displayed with each callstack
•Colour Coded Report for HTML reports, exports a coloured HTML table layout
The colour scheme is not configurable.
If you want a custom style, export a detailed XML report and process that to generate the HTML report.
•Group allocations with identical callstacks all events with the same callstack are grouped into one entry. This is similar to the Callstack grouping option on the Memory Display Settings.
File section
File options are relevant whether exporting an Types Report or a Memory Report.
•File type the filename or Browse to a location
•Format set whether exporting HTML or XML
Defaults to the menu option selected, but included here to more easily export one format and then the other.
For XML Memory exports, the following XML Memory tags are used.
For XML Types exports, the following XML Type tags are used.
•Encoding set whether UTF-16 LE, UTF-8 or ASCII encoding. By default the exported file is saved in the Windows Unicode format UTF-16 little endian. You can also save in UTF-8 and ASCII. ASCII has no byte order mark at the start of the file.
•OK exports the session data
Check the overwrite existing file option if you want to be warned about overwrites.