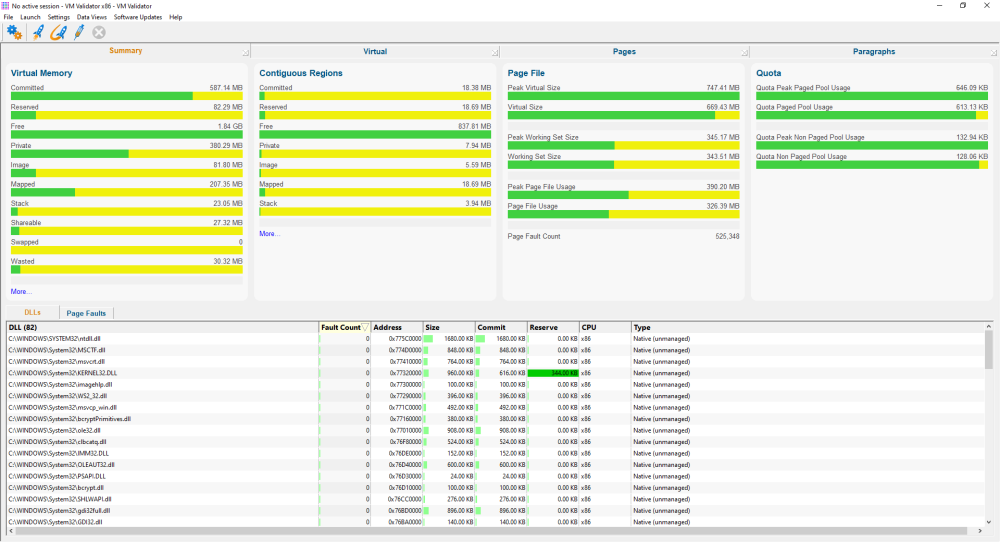
The Summary view allows you to get an overview of your application's memory usage.
Four main panels highlight key statistics and a lower panel with two tabs provides information about DLLs and page faults.
Overview
Virtual Memory - statistics about the virtual memory usage of the application.
•Committed. Committed memory.
•Reserved. Reserved memory.
•Free. Free memory.
•Private. Memory private to this application.
•Image. Executable files (EXE, DLL, etc).
•Mapped. Memory mapped files.
•Stack. Memory used for thread stacks.
•Shareable. Memory shared with other applications.
•Swapped. Memory swapped in/out of memory.
•Wasted. Memory allocated by VirtualAlloc() but not available to the application to use. What is wasted memory?
Clicking on one of these bars will take you to the Pages tab to display data about the type of memory that was clicked on.
Contiguous Regions - data about the largest contiguous region for each type of virtual memory. These values will let you easily determine if there is enough memory to satisfy a particular allocation request.
•Committed. Committed memory.
•Reserved. Reserved memory.
•Free. Free memory.
•Private. Memory private to this application.
•Image. Executable files (EXE, DLL, etc).
•Mapped. Memory mapped files.
•Stack. Memory used for thread stacks.
•Shareable. Memory shared with other applications.
Clicking on one of these bars will take you to the Pages tab to display data about the type of contiguous memory that was clicked on.
Page File - data about the working set and the page file.
•Peak Virtual Size
•Virtual Size
•Peak Working Set Size
•Working Set Size
•Peak Page File Usage
•Page File Usage
Quota - data about the paged and non-paged pool used by the operating system and device drivers.
•Quota Peak Page Pool Usage
•Quota Page Pool Usage
•Quota Peak Non Paged Pool Usage
•Quota Non Paged Pool Usage
For more information about paged and non-paged pool see https://blogs.technet.microsoft.com/markrussinovich/2009/03/10/pushing-the-limits-of-windows-paged-and-nonpaged-pool/
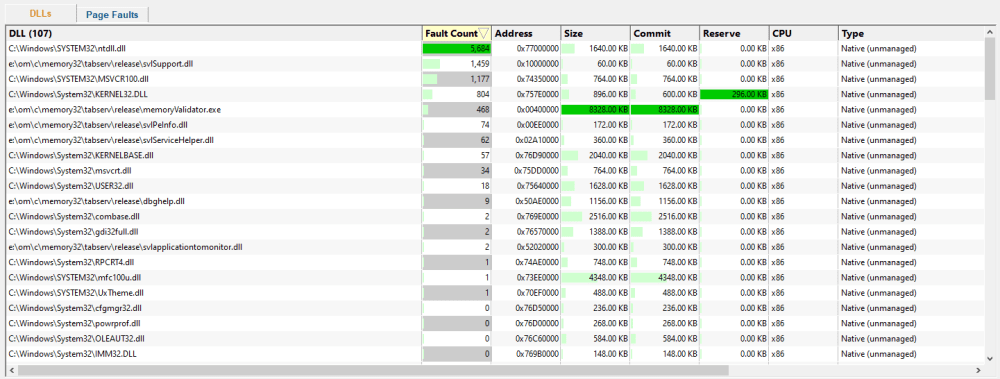
DLLs
A list of all DLLs in the application with statistics on page faults, load address, dll size, amount of committed memory, amount of reserved memory, the CPU it was built for (x86, x64, AnyCPU) and the type of DLL (native, managed, mixed-mode).
Note that AnyCPU, managed and mixed-mode only apply if a .Net application is being examined.
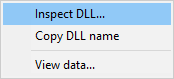
A context menu is available for the DLLs grid, to allow DLL inspection using PE File Browser, and to copy the DLL name to clipboard.
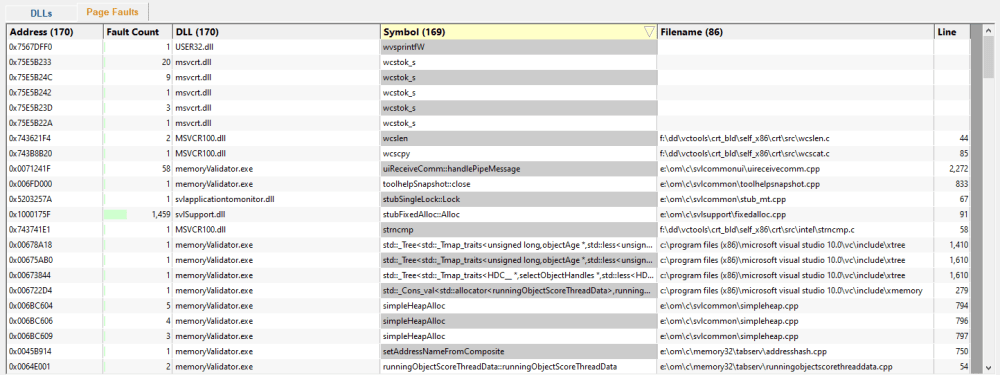
Page Faults
A list of all page faults that have been monitored, which DLL they were in (if any) and what symbol, filename and line number are related to that address.
If you have problems getting symbols you may want to change the settings used to obtain symbols.
This display doesn't include all page fault information. If you want detailed page fault information, download Page Fault Monitor from https://www.softwareverify.com/cpp-page-fault-monitor.php
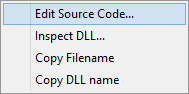
A context menu is available for the page faults grid, providing source code editing, DLL inspection, and copy the DLL name or filename to clipboard.