Fetching callstacks for all threads
Using the Deadlocked Thread PostMortem dialog below, you can retrieve all thread callstacks in your application.
This may be useful in many ways, but in particular, if you know a deadlock has occurred in your program, then examining the callstacks of each thread will help determine where the deadlock occurred.
The Deadlocked Thread PostMortem dialog
To show this dialog, choose the menu option below:
 Query menu
  choose Display stack traces for all threads... displays the dialog below
Or use the following icon on the Query Toolbar.

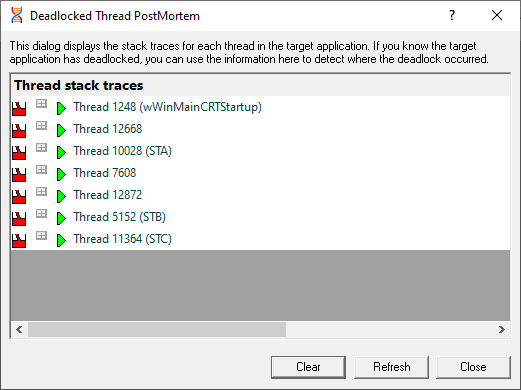
The dialog appears already populated with the callstack information
•Clear remove any existing results
•Refresh update the list of callstacks shown in the display
Viewing the callstacks
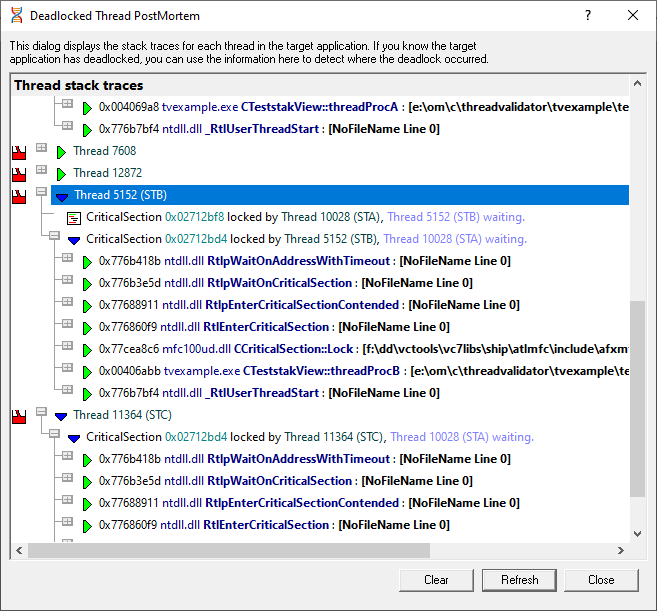
The image below shows the results of a search that has been expanded to show a callstack.
Note that above each callstack, the thread id (and name if the thread is named) is displayed followed by a list of critical sections which this thread has locked or is waiting upon.
For example:

If the thread is not waiting upon any critical sections and is not involved in a wait, a message No critical sections or waits for this thread is displayed.
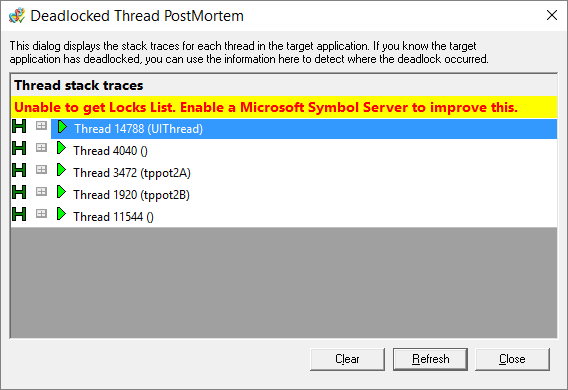
'Unable to get locks list' warning
If Thread Validator fails to find the process locks list it will provide a warning and information for what to do to enable the list to be found.
In this example, the suggestion is to enable a Microsoft Symbol Server.