Detecting memory leaks
This test (and most of those that follow) uses the example application nativeExample.exe.
The example program is run once and we use the Memory view to observe and investigate the memory leak.

launch nativeExample.exe  wait until attaching is complete

 File menu Exit
The example program automatically generates some memory leaks when it starts.
wait for data transfer to complete
The data collection indicators will be disabled when collection has stopped and all data for the session has been processed.
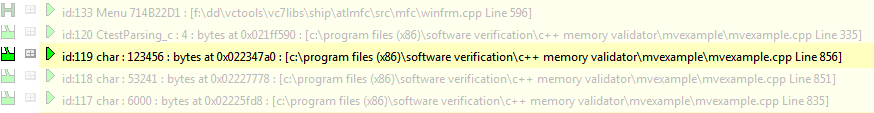
•Memory tab Refresh shows all leaked memory in the colour defined for leaks - yellow by default
One of the entries is an allocation of 123456 bytes:
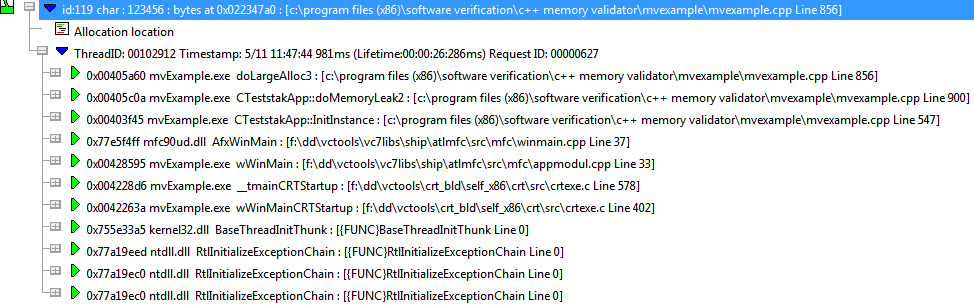
•expand the entry shows the allocation callstack
•expand the topmost entry on the callstack the source code fragment shows where the memory was allocated
If there is no source code, or it can't be found, you'll be prompted for the location.
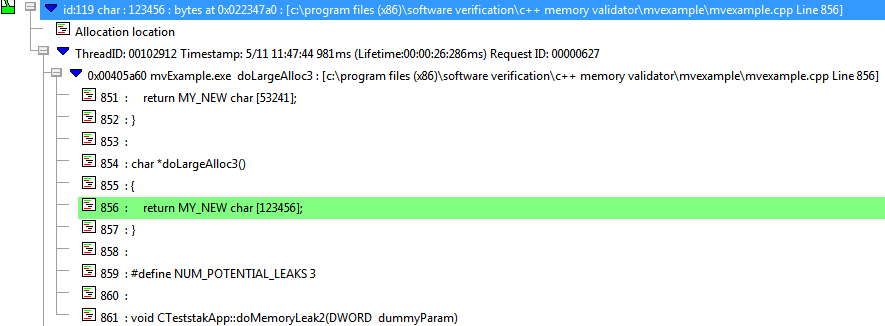
To edit the source code, double click on the source code.